
Dow Jones Industrial Average (DJIA) – Let’s look at the index’s key support and resistance analysis for the week of December, 27, 2019, using the weekly chart.

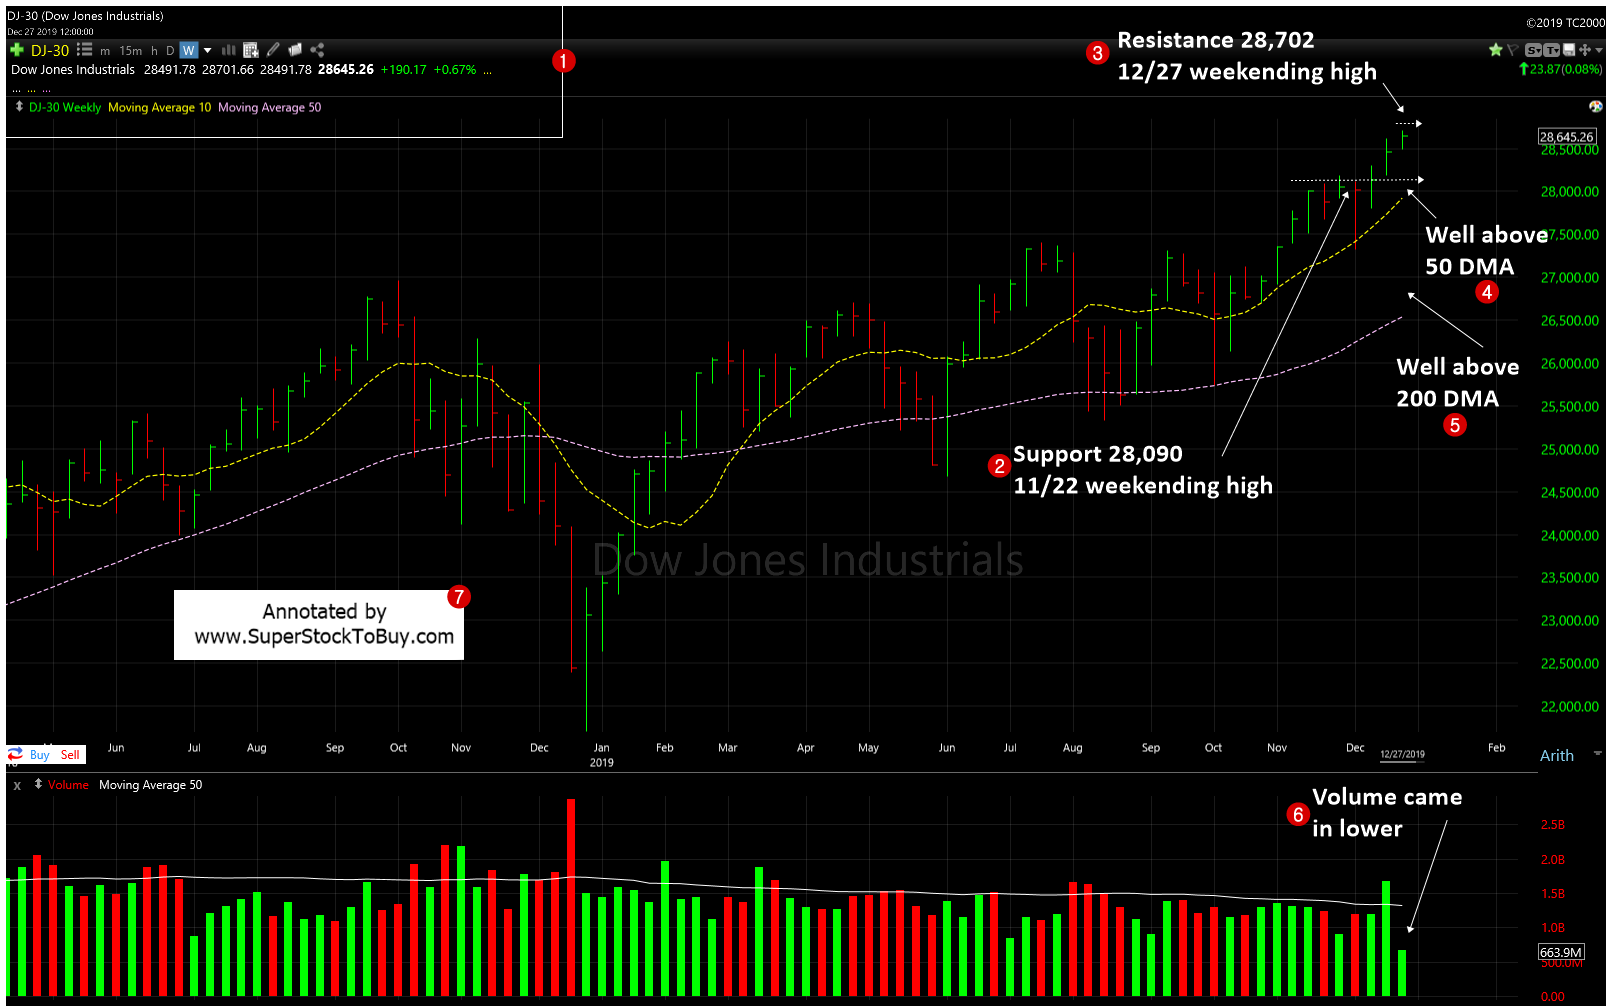
2. As the index posted another week of decent gains, the support moved to 28,090 which is the 11/22 weekending high.
3. As the index made another new high, but closed below it, the resistance changed to 28,702 which is 12/27 weekending high.
4. The index continues to trade well above the short term 50 day moving average (DMA) support line.
5. It continues to trade well above the 200 DMA, the long-term support line, as well.
6. The volume came in lower for the week with no surprise due to holidays.
So, the index had over all another nice week also closed at the top end of the weekly price swing.
The gains at the NASDAQ outperformed the Dow Jones, as S&P 500 performed in par. The NASDAQ also closed above the 9,000 mark levels. Leading growth stocks had a nice week, as well, as most of them posted solid gains.
So, the line of least resistance remains upwards and indices are moving up slowly, but steadily. So, just follow the trend until the zero hour arrives to change the course.
Around 154+ stocks posting over 5% gains in the Top Gainers – Growth Stocks Picks, as of this week.
Also do not forget to checkout the Stock Charts Gallery of annotated growth stock charts.
Snapshot of indices performance since 10/4 lows.
| Start | End | Diff (%) | |
| Dow | 25,743.46 | 28,645.26 | 11.27 |
| NASDAQ | 7,700.00 | 9,006.62 | 16.97 |
| S&P 500 | 2,855.94 | 3,240.02 | 13.45 |
Previous week chart:
