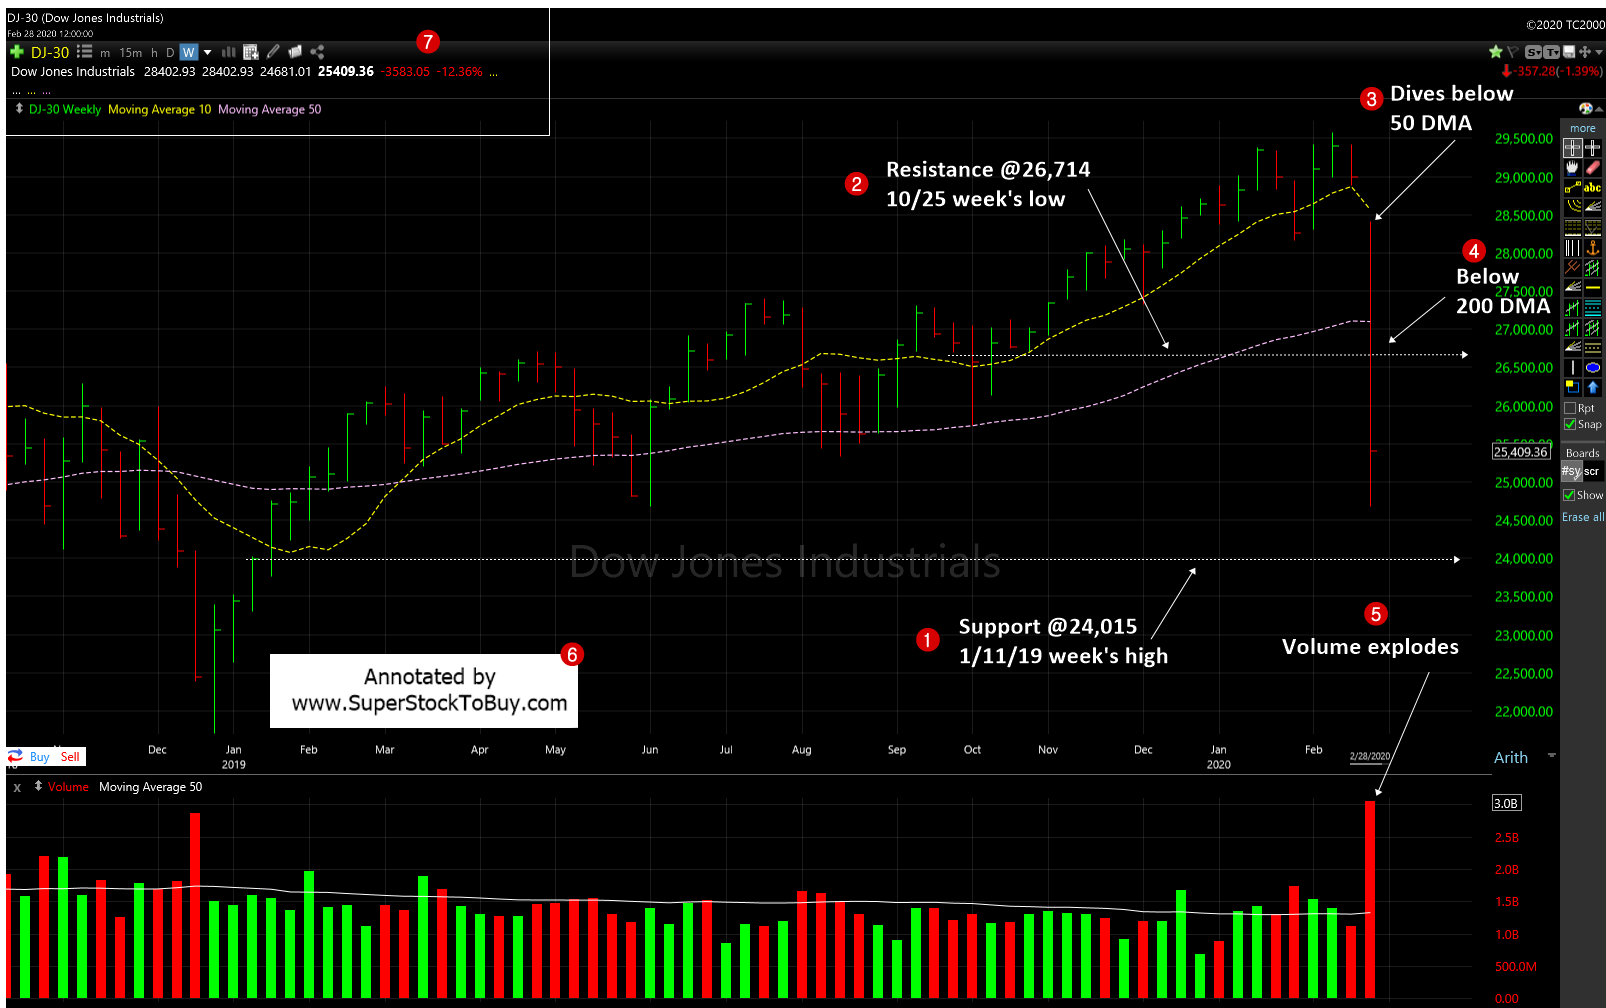
Dow Jones Industrial Average (DJIA) – Let’s look at the index’s key support and resistance analysis for the week of February, 28, 2020, using the weekly chart.

1. As the index had a nosedive, the support moved to 24,015 which is the 1/11/19 week’s high.
2. The resistance moved to 26,714 which is the 10/25/19 week’s low.
3. The index lost the short term 50 day moving average (DMA) support line.
4. The index also lost the long term 200 DMA support line.
5. The volume exploded and came in well above the last week’s levels.
The index gave up all gains made in the recent rally (which ran between 10/3/19 and 2/23/20) and some more. It’s trading almost -15% from the 52 week high.
The S&P 500 posted -11.5% loss and the NASDAQ posted around -10.5% loss for the week. The S&P 500 lost 200 DMA support, but the NASDAQ successfully tested that key support line. The Dow Jones and S&P 500 still signaling that the selloff is not over, yet. But the NASDAQ gave a small hint that the sell off got bottomed out.
Having said that, just stay put on the sidelines wait for a new rally to start. Some old leaders may drop off from the radar and new leaders will show up. So, be patience and wait for the correction to run the course and don’t get sandwiched in the stampede period.
Around 52+ stocks posting over 5% gains in the Top Gainers – Growth Stocks Picks, as of this week.
Also do not forget to checkout the Stock Charts Gallery of annotated growth stock charts.
Index performance as of 2/27:
| End | From 52 week high | YTD (%) | |
| Dow | 25,409.36 | -14.07 | -10.96 |
| NASDAQ | 8,567.37 | -12.92 | -4.52 |
| S&P 500 | 2,954.22 | -12.95 | -8.56 |
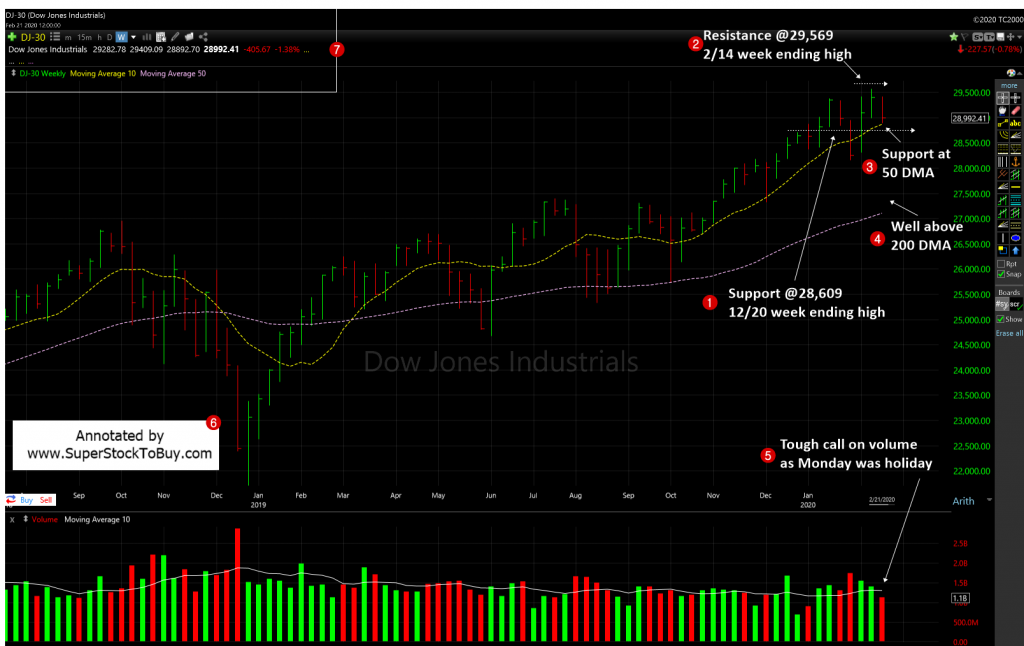
Previous week chart: