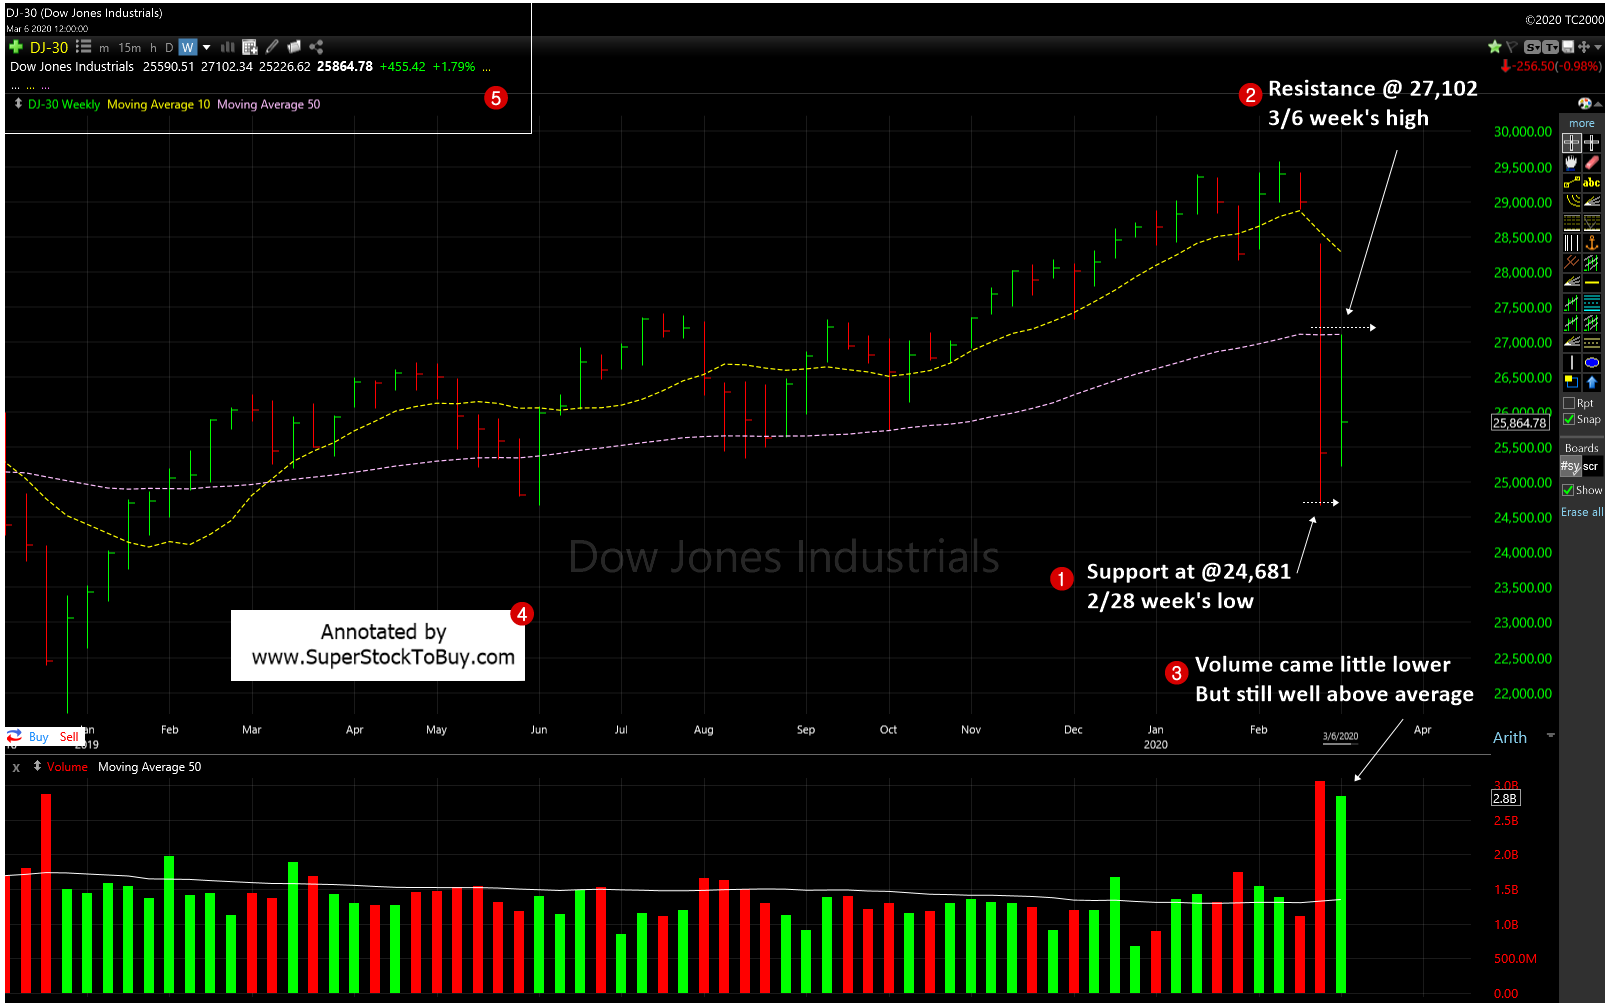
Dow Jones Industrial Average (DJIA) – Let’s look at the index’s key support and resistance analysis for the week of March, 06, 2020, using the weekly chart.

1. Though, the trade was very volatile this week, as the index still managed to end well above the last week’s low, the support moved to 24,681.
2. The resistance moved to 27,102 which is the 3/6 week’s high.
3. The index is trading well below the short term 50 day moving average (DMA) support line.
4. The index ran in to resistance at the long term 200 DMA support line when it tried to regain it.
5. The volume came in lower than last week’s level, but still well above average level.
The index witnessed a very volatile week where 3% price swing was very common. But, still ended the week in green.
The S&P 500 posted +.61% and the NASDAQ posted around +.10% gains for the week. The S&P 500 also ran into resistance at the 200 DMA support, but the NASDAQ successfully tested that key support line, again. The NASDAQ also signaled a new rally on 3/4, but it came under pressure, right away.
So, it appears to be the selloff got bottomed out for now. Mega cap growth stocks continue witness volatile trading. “Clear Trend” is one of the key ingredients to successfully trade the growth stocks. It’s missing now. So, it’s better to be on the sidelines and not get sandwiched in this stampede period.
Around 51+ stocks posting over 5% gains in the Top Gainers – Growth Stocks Picks, as of this week.
Also do not forget to checkout the Stock Charts Gallery of annotated growth stock charts.
Snapshot of indices performance since 2/28 low.
| Start | End | Diff (%) | Max gain(%) | From 52 week high(%) | YTD (%) | |
| Dow | 24,681.01 | 25,457.21 | 3.14 | 9.81 | -13.90 | -10.80 |
| NASDAQ | 8,264.16 | 8,575.62 | 3.77 | 9.75 | -12.83 | -4.42 |
| S&P 500 | 2,855.84 | 2,972.37 | 4.08 | 9.84 | -12.41 | -8.00 |
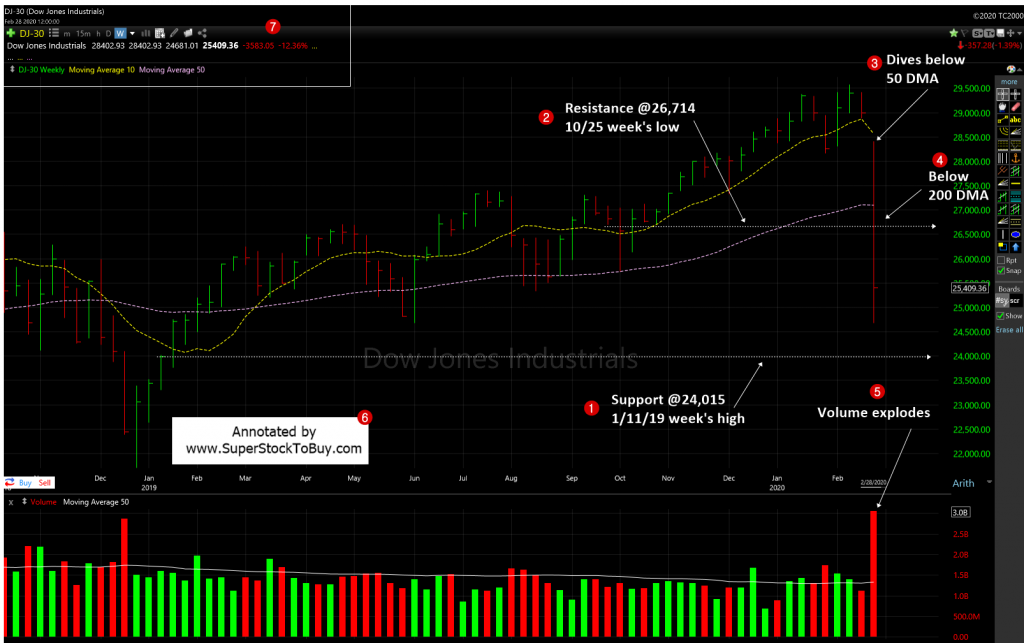
Previous week chart: