Dow Jones Industrial Average (DJIA) – Let’s look at the index’s key support and resistance analysis for the week of March, 13, 2020, using the weekly chart.
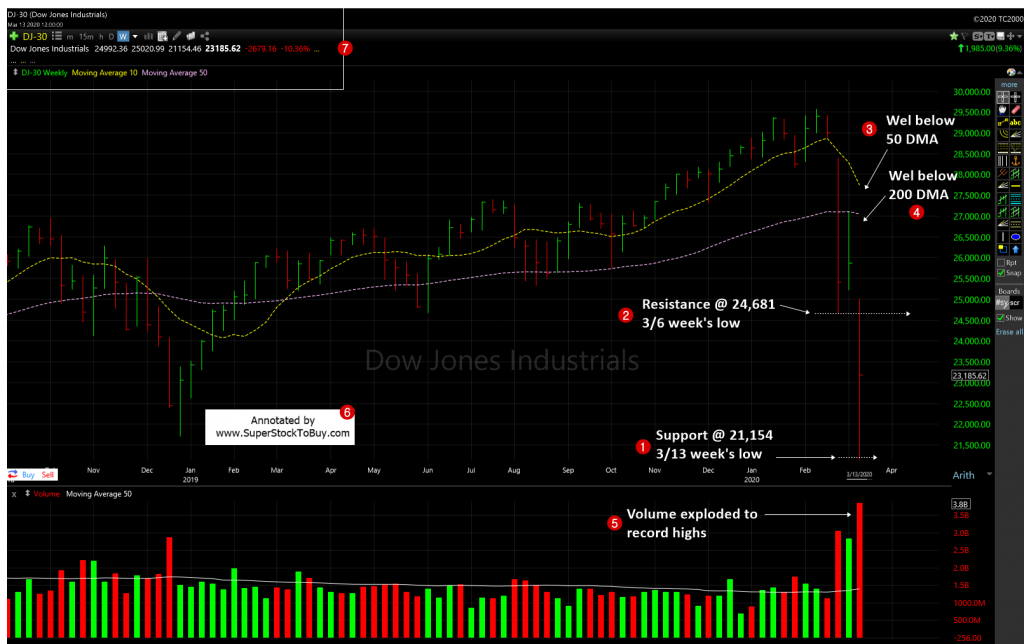
1. As the index witnessed another very volatile week the support moved to 21,154.
2. The resistance moved to 24,681 which is the 3/6 week’s low.
3. The index is trading well below the short term 50 day moving average (DMA) support line.
4. The index is trading well below the long term 200 DMA support line, as well.
5. The volume exploded to a record levels.
The index witnessed a very volatile week where 3% price swing was very common. It recouped some of the losses, but didn’t finish at the top end for the week.
The S&P 500 posted -8.79% and the NASDAQ posted around -8.17% loss for the week. The NASDAQ ran into resistance at the 200 DMA line.
So, we are in a bear market now. The concerns is, how did it come so quick without an orderly decline. The old saying is “Trend is your friend”, but as there is no clear trend, just stay put and be on the sidelines as the market is pretty much driven by news and panic.
Around 9+ stocks posting over 5% gains in the Top Gainers – Growth Stocks Picks, as of this week. It was over +175 stocks few weeks, ago.
Also do not forget to checkout the Stock Charts Gallery of annotated growth stock charts.
Snapshot of indices performance:
| End | From 52 week high | YTD (%) | |
| Dow | 23,185.62 | -21.59 | -18.76 |
| NASDAQ | 7,874.88 | -19.96 | -12.23 |
| S&P 500 | 2,711.02 | -20.11 | -16.09 |
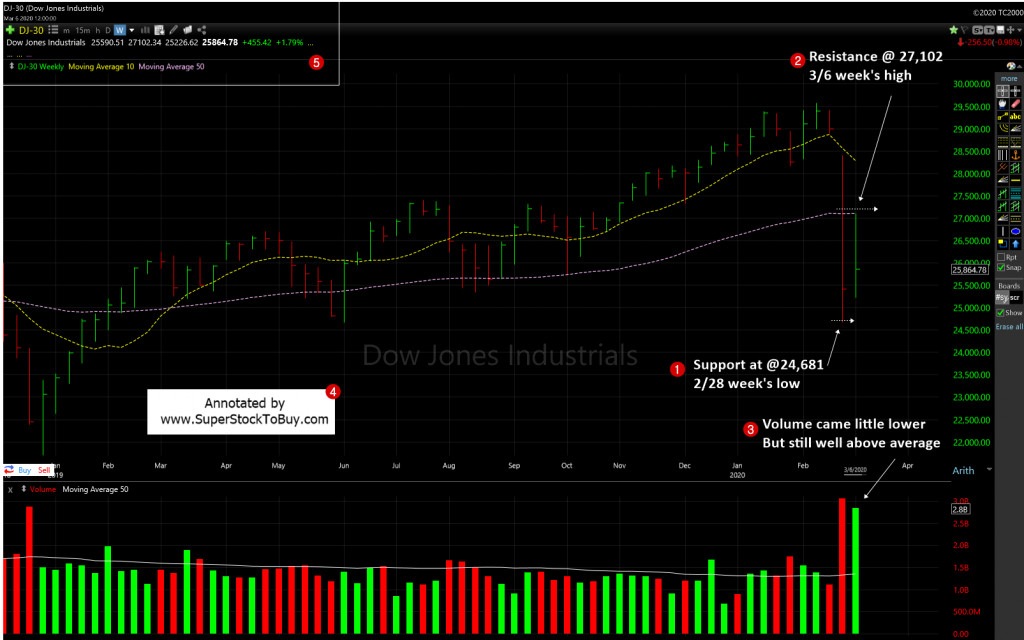
Previous week chart: