
Dow Jones Industrial Average (DJIA) – Let’s look at the index’s key support and resistance analysis for the week of August, 30th 2019 using the weekly chart.
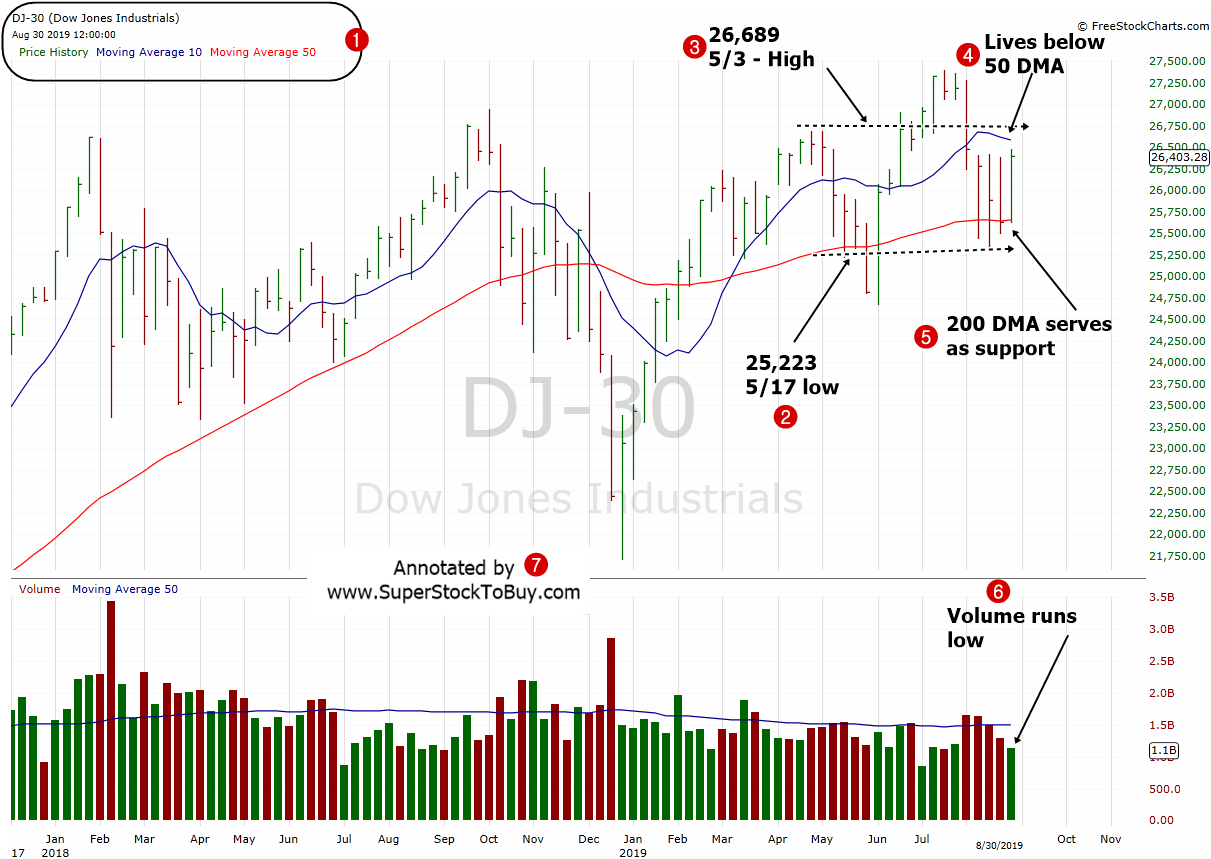
2. The support continues to reside around 25,223 which is the 5/17 weekending low.
3. The resistance continues to hover around 26,689 which is the 5/3 weekending high.
4. The index lives well below the 50 day moving average which is a key weakness, but ready to take the support back.
5. However, the index found support at the 200 day moving average which is consider a long term support line.
6. The overall trading volume appears to be came in low for the week, as well.
Over all the index ended the week with rock solid gains, but the weekly volume appears to came in lower than below average. Ideally, we like to see the volume goes up when the index makes gain. It will be interesting to see whether the index retake the key 50 DMA support line next week.