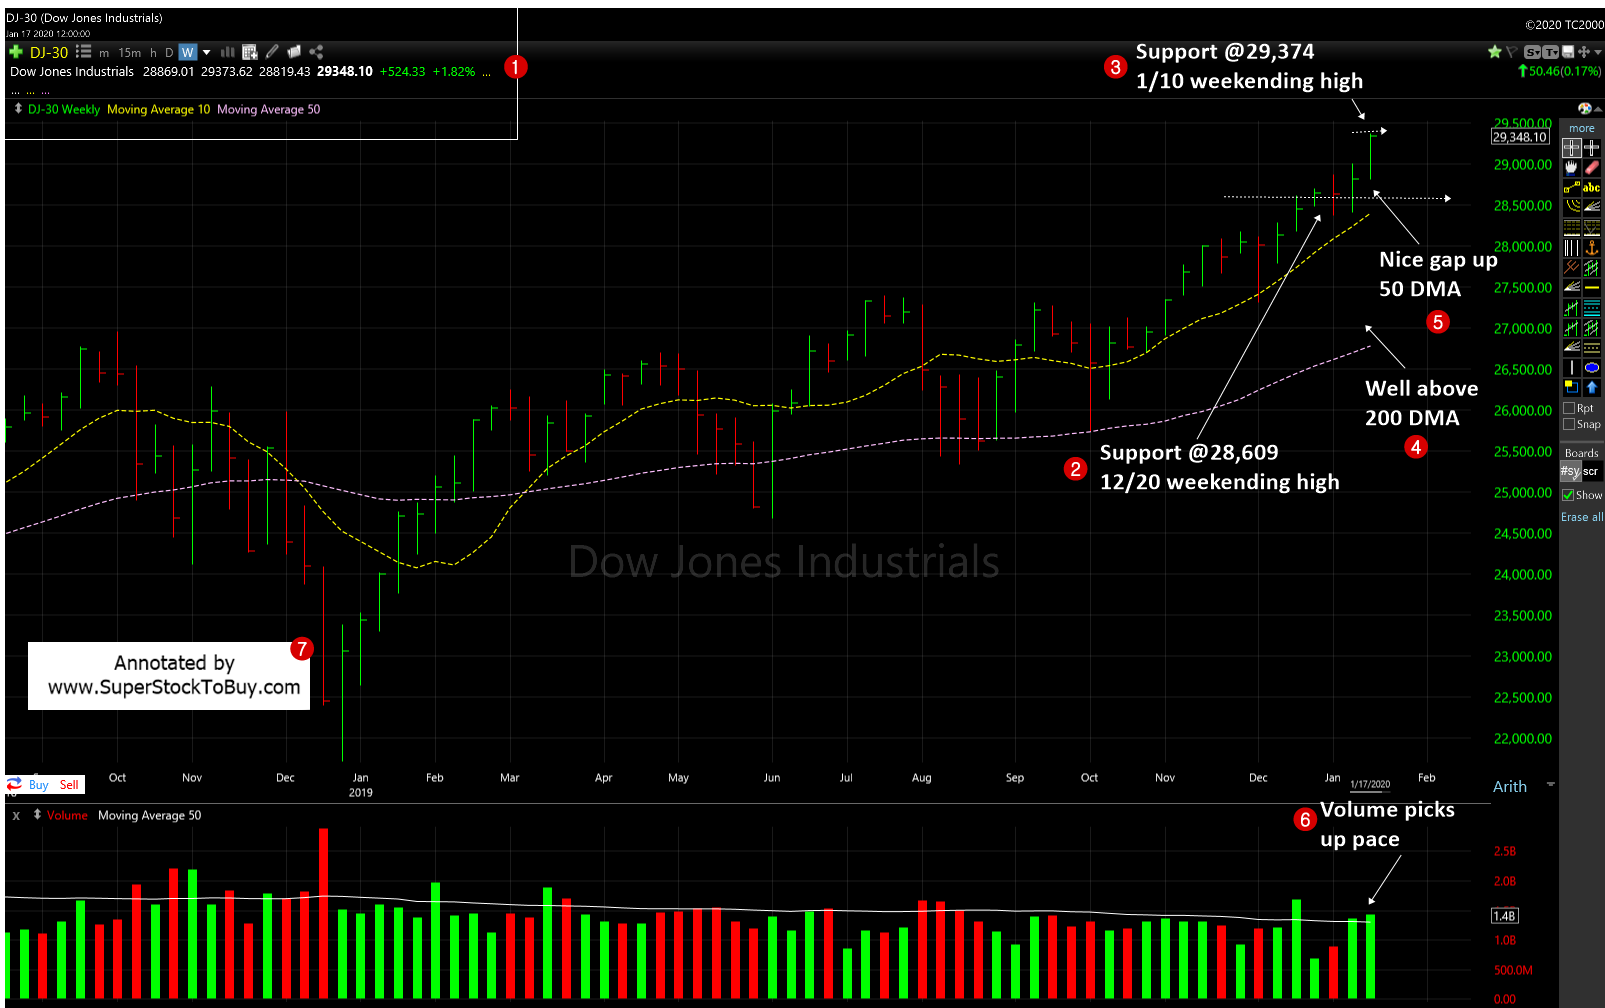
Dow Jones Industrial Average (DJIA) – Let’s look at the index’s key support and resistance analysis for the week of January, 17, 2020, using the weekly chart.

2. As the index posted solid gains for the week, the support moved to 28,609 which is the 12/20 weekending high.
3. As the index made another new high, but closed below it, the resistance changed to 29,374 which is 1/17 weekending high.
4. The index trading nicely above the short term 50 day moving average (DMA) support line.
5. It continues to trade well above the 200 DMA, the long-term support line.
6. The volume picked up pace and came in heavier than last week and above average as well.
The index posted solid gains for the week on heavier volume and displayed a constructive action.
The S&P 500 posted close to +2% gain. But, the NASDAQ posted solid +2.29% gain and out performed, this week, as well. The mega cap growth stocks such as MSFT, FB, APPL continue to charged ahead and had a nice accumulation, as well.
So, the line of least resistance remains upwards since 10/4/19. So, just follow the trend until the zero hour arrives to change the course.
Around 198+ stocks posting over 5% gains in the Top Gainers – Growth Stocks Picks, as of this week.
Also do not forget to checkout the Stock Charts Gallery of annotated growth stock charts.
Snapshot of indices performance since 10/4 lows.
| Start | End | Diff (%) | |
| Dow | 25,743.46 | 29,348.10 | +14.00 |
| NASDAQ | 7,700.00 | 9,388.94 | +21.93 |
| S&P 500 | 2,855.94 | 3,329.62 | +16.59 |
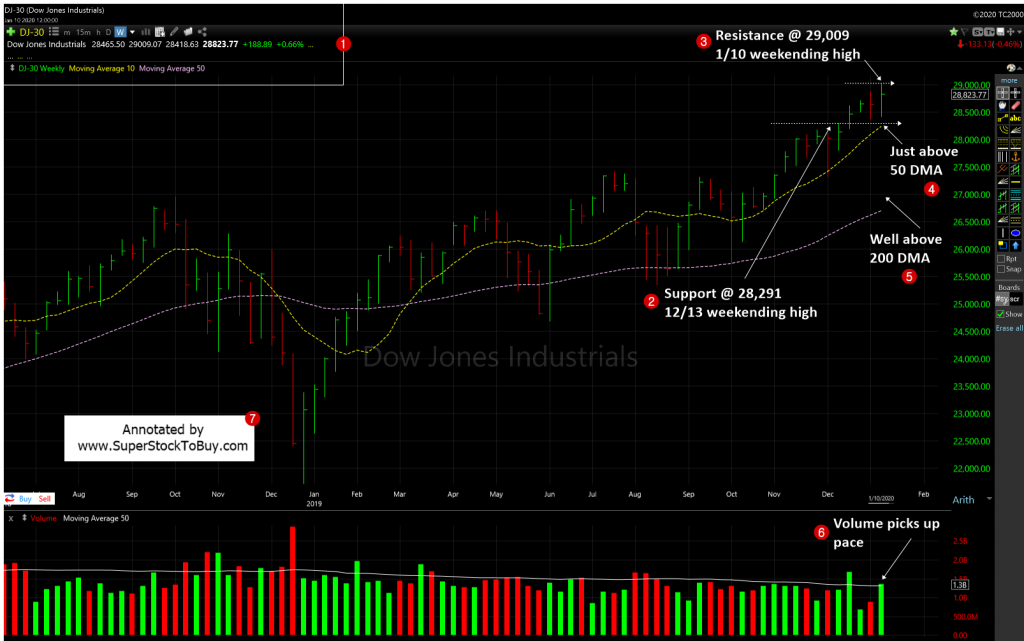
Previous week chart: