
Dow Jones Industrial Average (DJIA) – Let’s look at the index’s key support and resistance analysis for the week of September 6th , 2019 using the weekly chart.
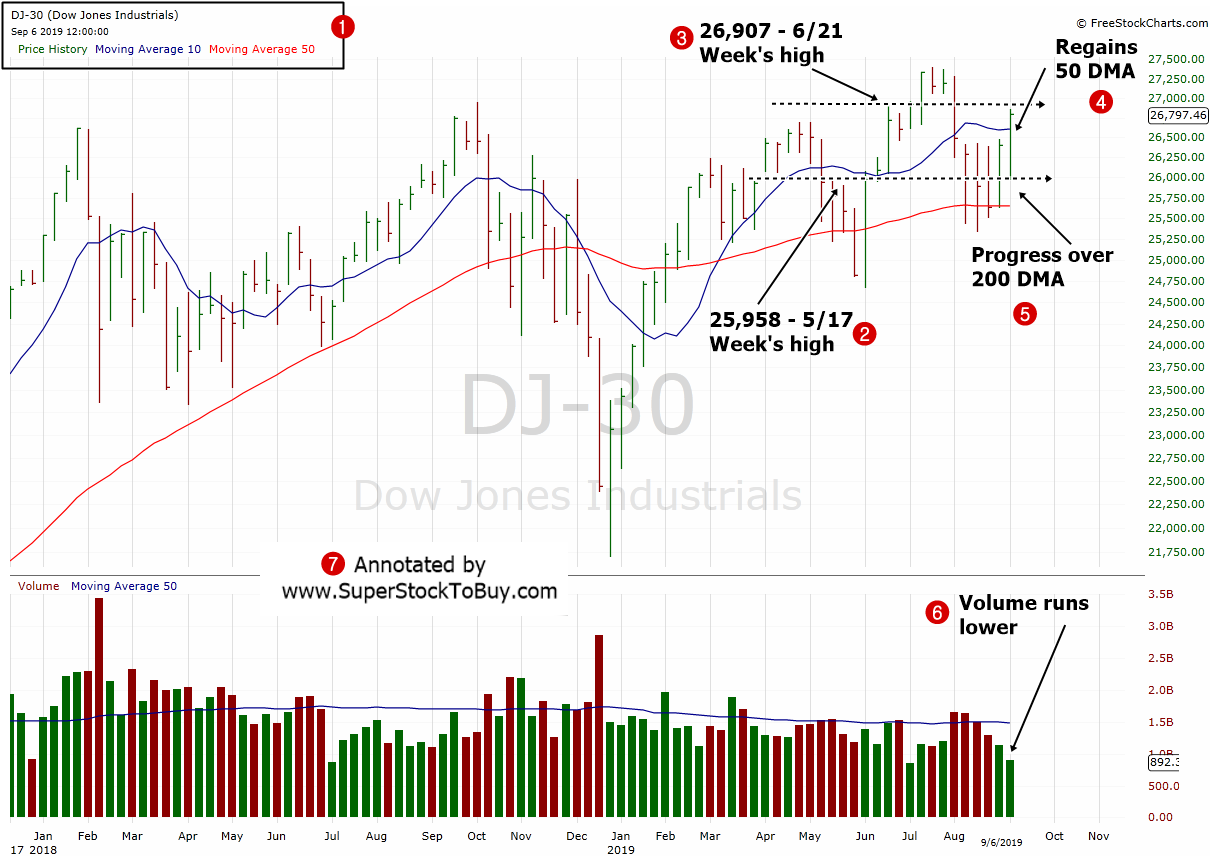
2. As the indexed moved up higher for the week, so the support, it resides around 25,958 which is the 5/17 weekending high.
3. The resistance changed to 26,907 which is the 6/21 weekending high.
4. The index regained the key 50 day moving average support, which is a key for any promising uptrend.
5. The index showed the progress gap between the 200 day moving average and it’s weekending low.
6. The overall trading volume appears to be came in low for the week, as well.
Over all the index ended the week with decent gains. Ideally, we like to see the volume goes up when the index makes gain. But, during this volatile period, we can take the low volume trading and take it big players on the sidelines. It will be interesting to see whether the trading volume picks up as the summer is almost over.
Over 25+ stocks over 5% gains in the Top Gainers – Growth Stocks Picks, as of this week.