

Dow Jones Industrial Average (DJIA) – Let’s look at the index’s key support and resistance analysis for the week of October, 18, 2019, using the weekly chart.
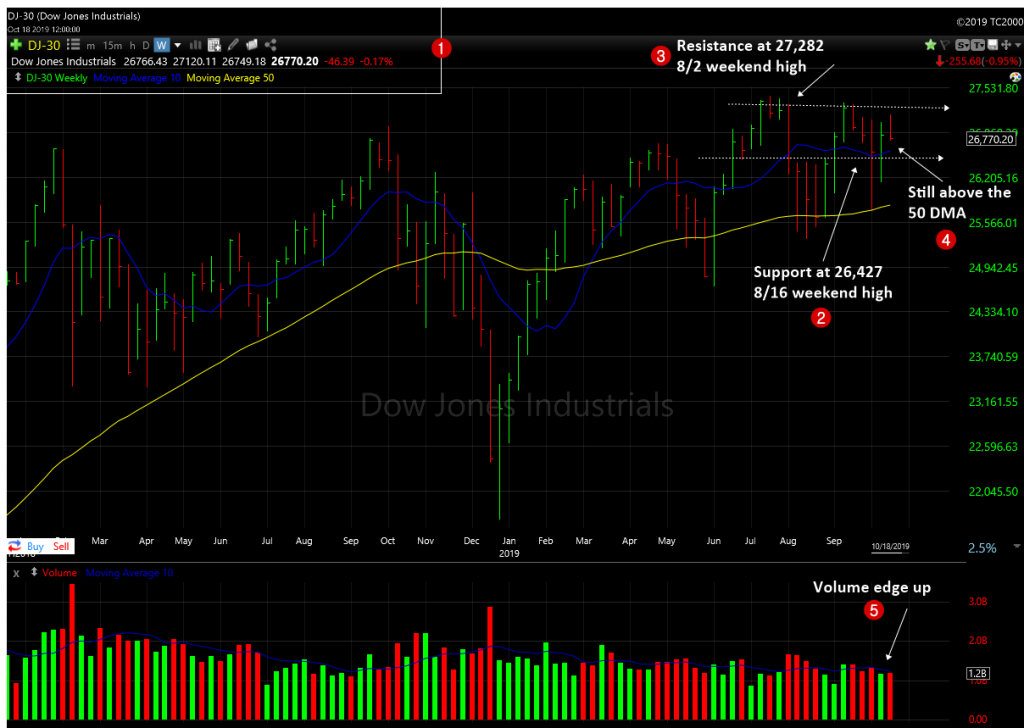
2. Though the index gained traction in the beginning of the week, it ended up losing the momentum as the week progressed and ended the week pretty flat. As the index still trading well above the last week’s low, the support line moved to 26,427 which is the 8/16 weekending high.
3. The resistance changed little bit and it’s at 27,282 which is the 8/2 weekending high.
4. The index is still trading above the 50 day moving average line, as well.
5. The overall trading volume appear to came in higher for the week.
Over all the index ended the week flat for the week. But, in the weekly chart it ended at lower bottom of the handle. The volume picked up pace when it receded on Friday, as well. But, in the weekly chart it’s still trading above the 50 DMA. So, overall no alarm raised yet.
The NASDAQ and S&P 500 outperformed the Dow Jones and ended the week in green.
Leading growth stocks over all had a good week, as most of the made gains or didn’t loose much ground.
So, as of now, the long term up trend continues to get the benefit of the doubts.
Around 23+ stocks posting over 5% gains in the Top Gainers – Growth Stocks Picks, as of this week.
Also do not forget to checkout the Stock Charts Gallery of annotated growth stock charts.