
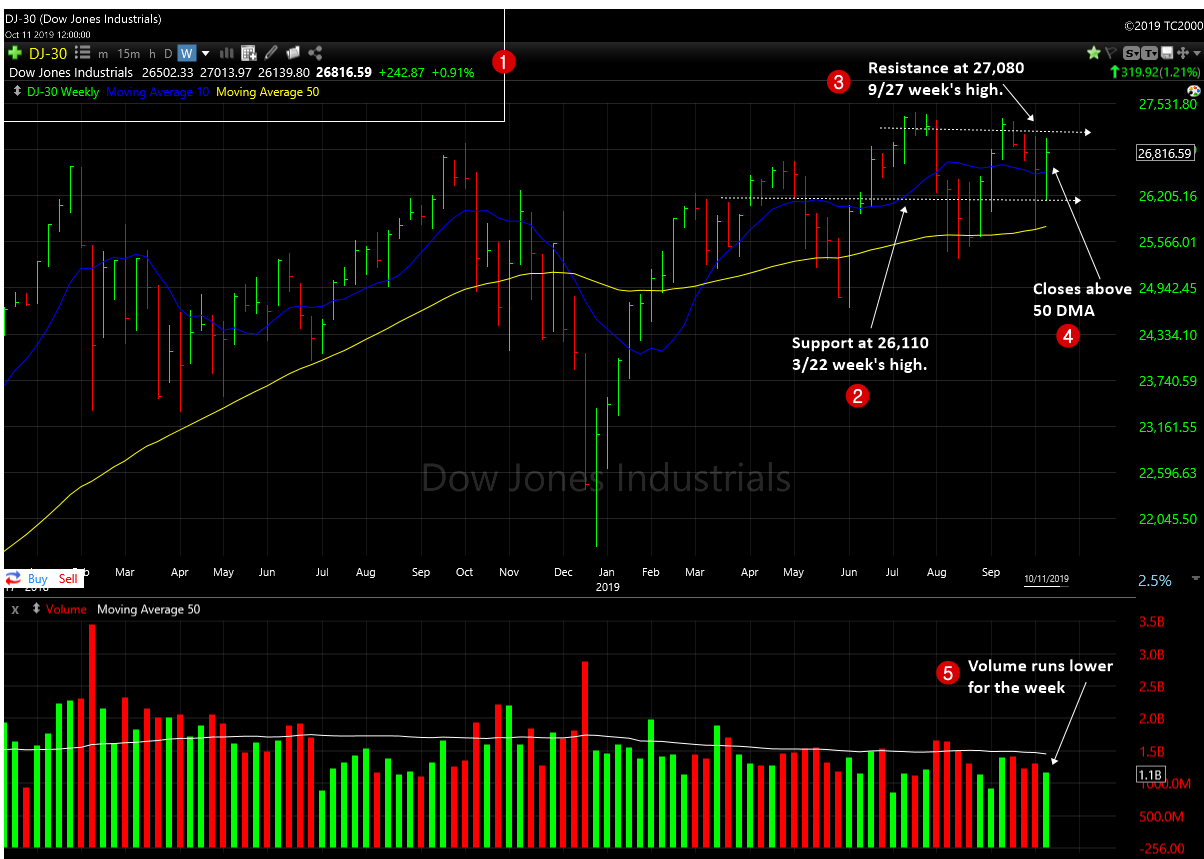
Dow Jones Industrial Average (DJIA) – Let’s look at the index’s key support and resistance analysis for the week of October, 11, 2019, using the weekly chart.

2. As the index regained the momentum as the week ended, the support line regained some traction, as well. It’s at 26,110 which is the 3/22 weekending high.
3. The resistance remains at last week’s level. It’s at 27,080 which is the 9/27 weekending high.
4. The index regained the 50 day moving average line and closed well above it.
5. The overall trading volume appears to be came in lower for the week.
Over all the index ended the week with closer 1% gains after witnessing another volatile week. Though, the trading volume came in lower for the week, it picked up pace on Friday when the index posted solid gain.
The NASDAQ and S&P 500 more or less acted inline with the Dow Jones, though NASDAQ is a lagger lately.
Leading growth stocks over all had a good week, and some new leaders started to pop-up in the radar, now.
So, as of now, the long term up trend still gets the benefit of the doubts.
Around 18+ stocks posting over 5% gains in the Top Gainers – Growth Stocks Picks, as of this week.
Also do not forget to checkout the Stock Charts Gallery of annotated growth stock charts.