
Dow Jones Industrial Average (DJIA) – Let’s look at the index’s key support and resistance analysis for the week of September, 13, 2019, using the weekly chart.
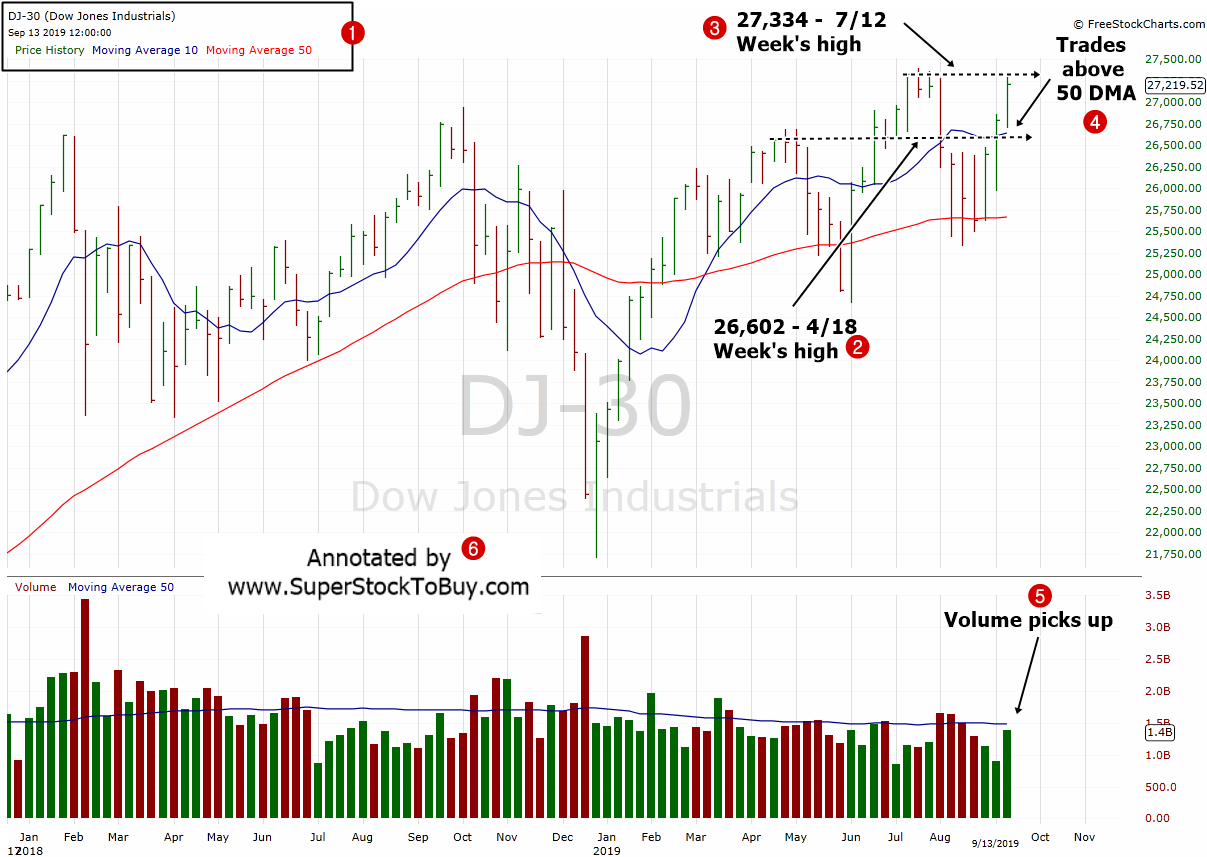
2. As the index moved up higher for the week, so the support, it resides around 26,602 which is the 4/18 weekending high.
3. The resistance changed to 27,334 which is the 7/12 weekending high.
4. The index traded over the key 50 day moving average support line which showed the much needed strength of the current up trend.
5. The overall trading volume appears to be picked up finally, as well.
Over all the index ended the week with another decent gains over 1.5%. The trading volume also picked up finally which is another positive sign. So, let’s see the index makes a new high in the up coming week and if it recedes, hope it hangs around the 50 DMA support line.
Around 23+ stocks posting over 5% gains in the Top Gainers – Growth Stocks Picks, as of this week.
Also do not forget to checkout the Stock Charts Gallery of annotated growth stock charts.