
Dow Jones Industrial Average (DJIA) – Let’s look at the index’s key support and resistance analysis for the week of February, 14, 2020, using the weekly chart.

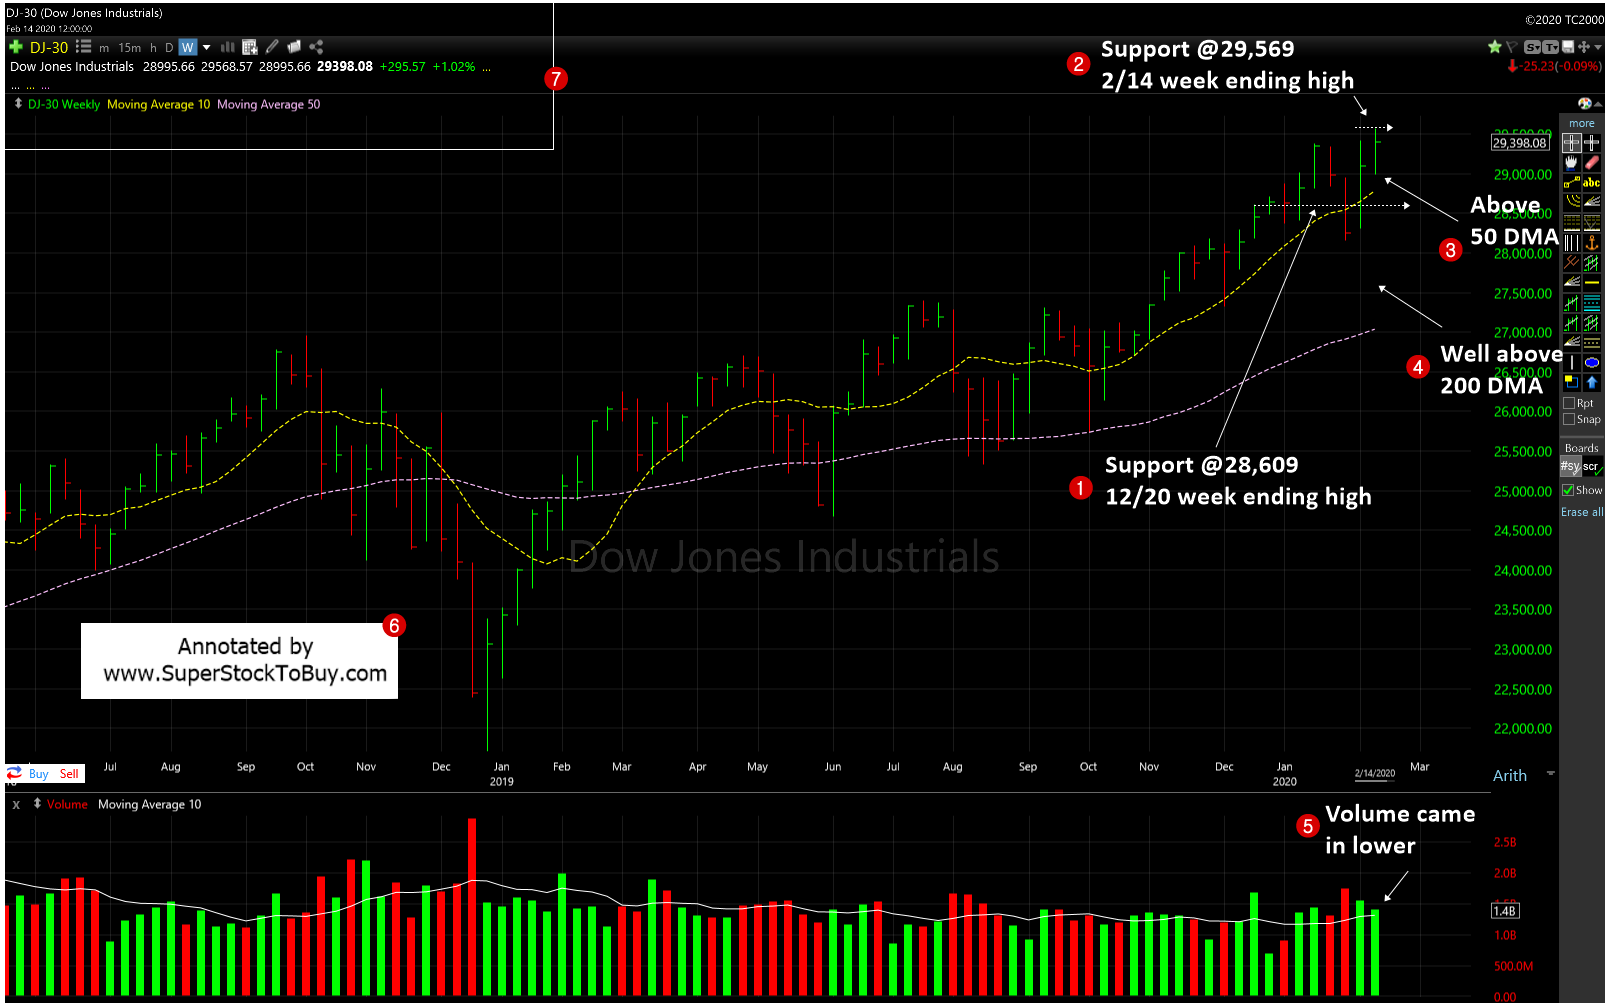
1. As the index posted solid gains for the week, the support is moved to 28,609 which is the 12/20 week ending high.
2. As the index made a new all-time high, the resistance is moved to 29,569 which 2/14 weekending high.
3. The index closed above the short term 50 day moving average (DMA) support line.
4. The index continues to trade well above the 200 DMA, the long-term support line, as well.
5. However, the volume came in lower than last week levels.
The index posted +1% gains which is not bad when we consider the volatility witnessed during the week. It would have been nice if the volume came in heavier for the week.
The S&P 500 posted over +1.5% gains but the NASDAQ posted solid +2.21% gains and outperformed this week, as well. Mega cap growth stocks, such as MSFT, APPL, and FB, pretty much ended the week on a flat note, though.
So the uptrend, which is started the week of 10/4/19, is continuing now. Several of our leading growth stocks continue to offer potential reentry points, as well.
Around 200+ stocks posting over 5% gains in the Top Gainers – Growth Stocks Picks, as of this week.
Also do not forget to checkout the Stock Charts Gallery of annotated growth stock charts.
Snapshot of indices performance since 10/4 lows.
| Start | End | Diff (%) | From 52 week high | YTD (%) | |
| Dow | 25,743.46 | 29,398.08 | 14.20 | -0.58 | 3.01 |
| NASDAQ | 7,700.00 | 9,731.18 | 26.38 | -0.18 | 8.45 |
| S&P 500 | 2,855.94 | 3,380.16 | 18.36 | -0.15 | 4.62 |
Previous week chart:
