Dow Jones Industrial Average (DJIA) – Let’s look at the index’s key support and resistance analysis for the week of January, 03, 2020, using the weekly chart.
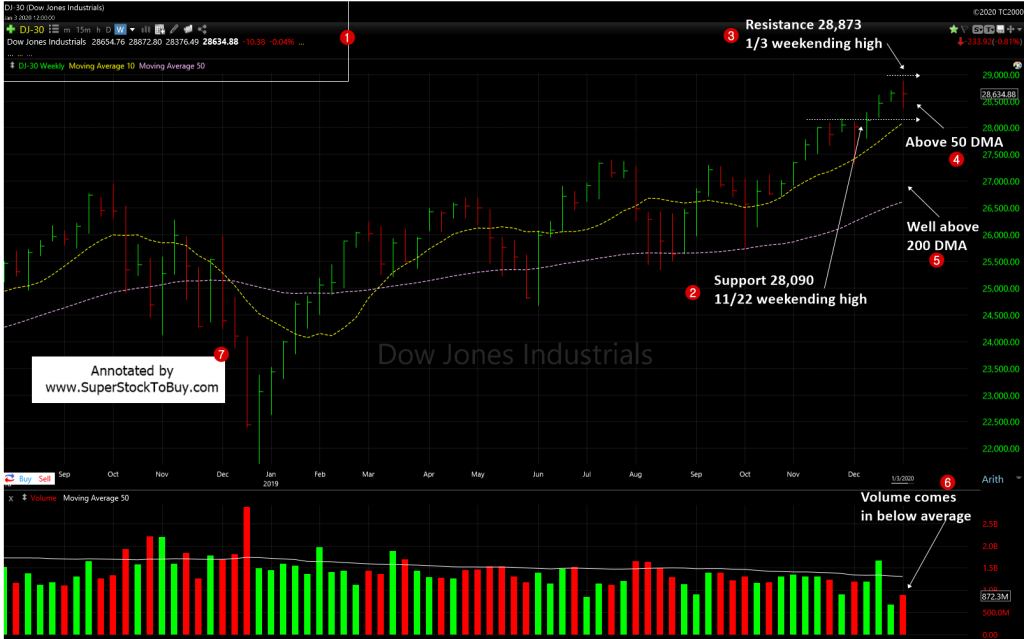
2. As the index posted mild losses for the week, the support remains at 28,090 which is the 11/22 weekending high.
3. As the index made another new high, but closed below it, the resistance changed to 28,873 which is 1/3 weekending high.
4. The index continues to trade well above the short term 50 day moving average (DMA) support line.
5. It continues to trade well above the 200 DMA, the long-term support line, as well.
6. The volume came in little higher than last week, but still came in below the average.
Though, the index closed in red, the pull back appears to be normal given the recent run up. The Friday’s loss was not too bad at all.
The S&P 500 also closed the week with mild losses. However, the NASDAQ still able to close in green regardless of the Friday’s pullback. The mega cap growth stocks such as MSFT, FB, APPL charged ahead and weathered the Friday’s pullback, as well.
So, the line of least resistance remains upwards as we start the new year. So, just follow the trend until the zero hour arrives to change the course.
Around 150+ stocks posting over 5% gains in the Top Gainers – Growth Stocks Picks, as of this week.
Also do not forget to checkout the Stock Charts Gallery of annotated growth stock charts.
Snapshot of indices performance since 10/4 lows:
| Start | End | Diff (%) | |
| Dow | 25,743.46 | 28,634.88 | 11.23 |
| NASDAQ | 7,700.00 | 9,020.77 | 17.15 |
| S&P 500 | 2,855.94 | 3,234.85 | 13.27 |
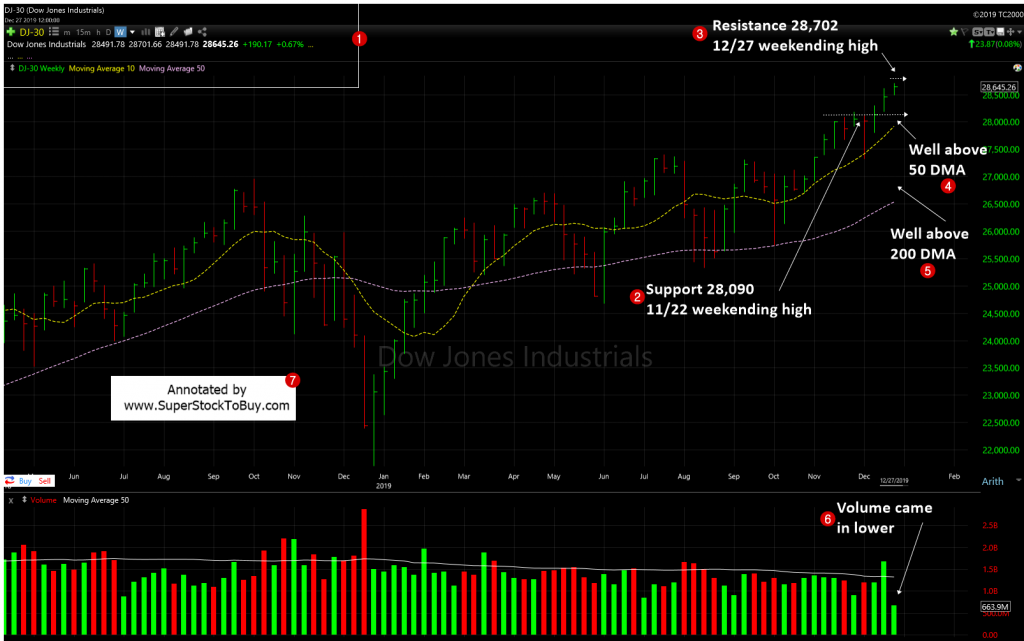
Previous week chart: