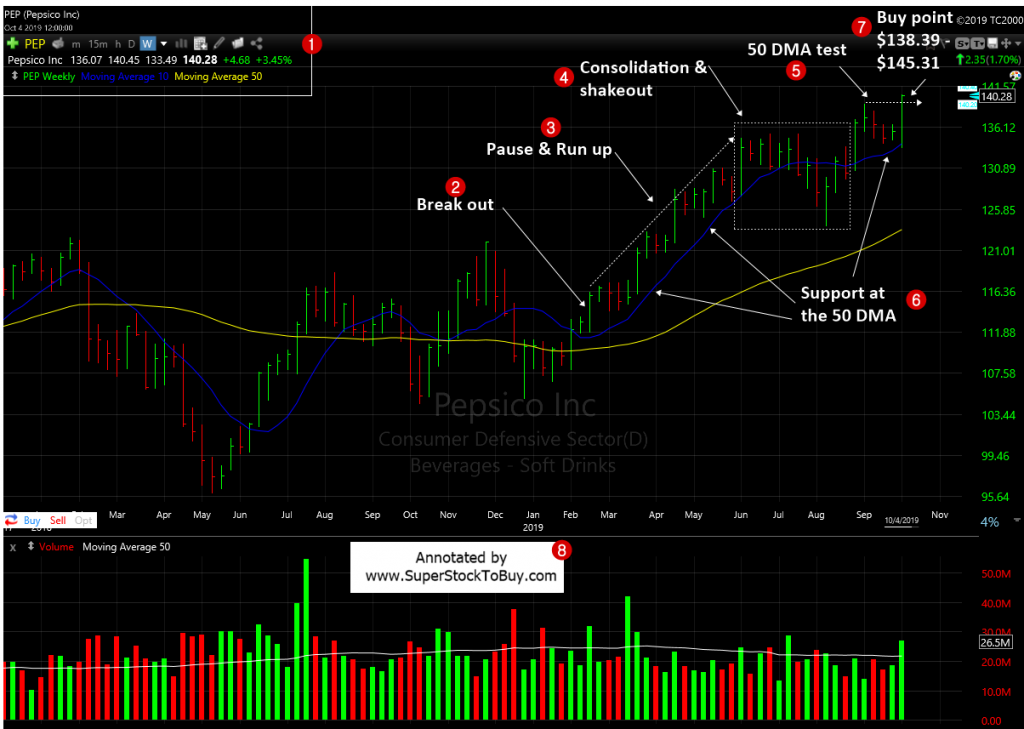
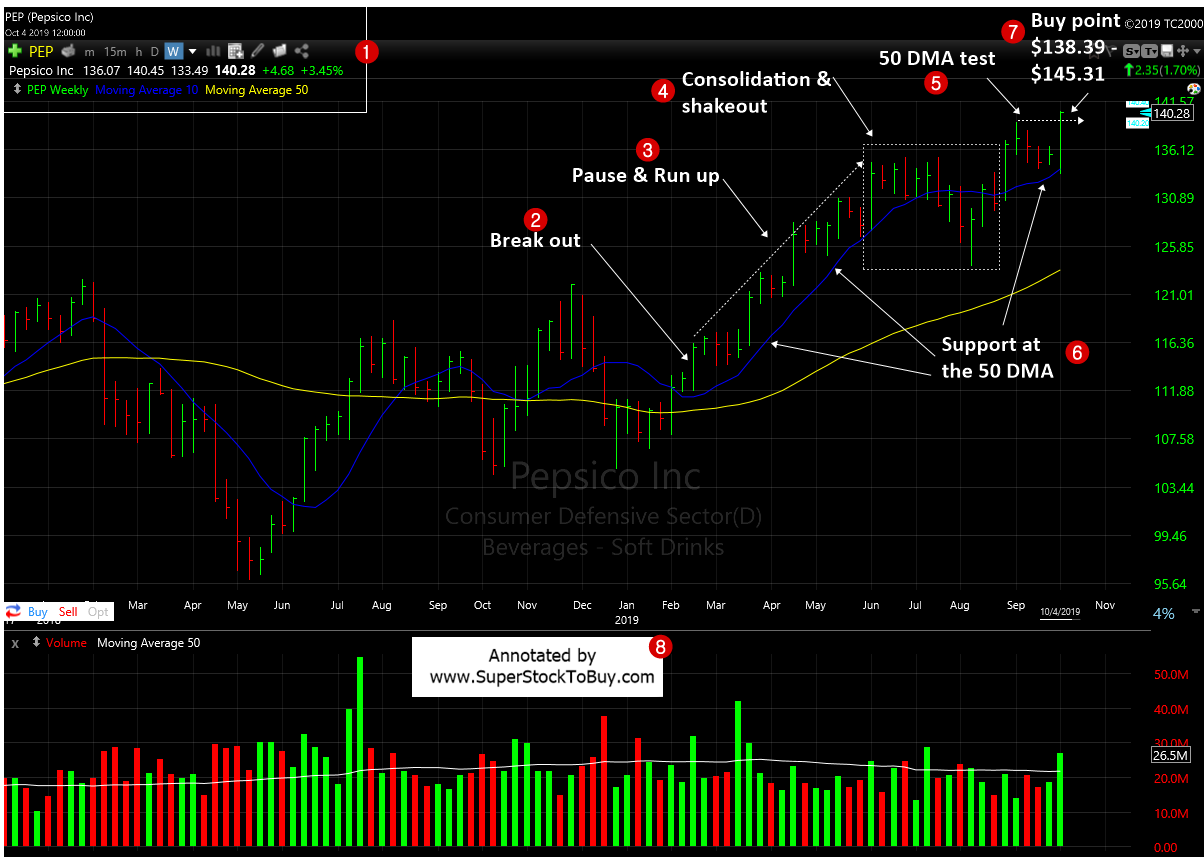
PepsiCo Inc. (PEP) – stock is trading around $140.28 dollars as of October, 07, 2019 and offering a possible buying price between $138.39 – $145.31. Let’s look at the stocks technical actions using a weekly chart.

2. The stock breakout back in end of March.
3. The stock staged a solid run after that. It also took some pause and consolidated the gains along the way.
4. The stock went through a consolidation and shakeout period after that. It’s even dived below the 50 day moving average (DMA).
5. The stock came out of the shakeout and a staged breakout, but immediately started to recede. But, this time it found support at the 50 DMA.
6. The stock also found support at the 50 DMA numerous times since the March breakout.
7. The stock is offering possible buying price between $138.39 – $145.31, with a stop loss at $127.32.
This stock is already part of the Stocks Above 100 Dollars pick and performance will be tracked here .
Also do not forget to checkout the Stock Charts Gallery of annotated growth stock charts.


