
Dow Jones Industrial Average (DJIA) – Let’s look at the index’s key support and resistance analysis for the week of October, 04, 2019, using the weekly chart.

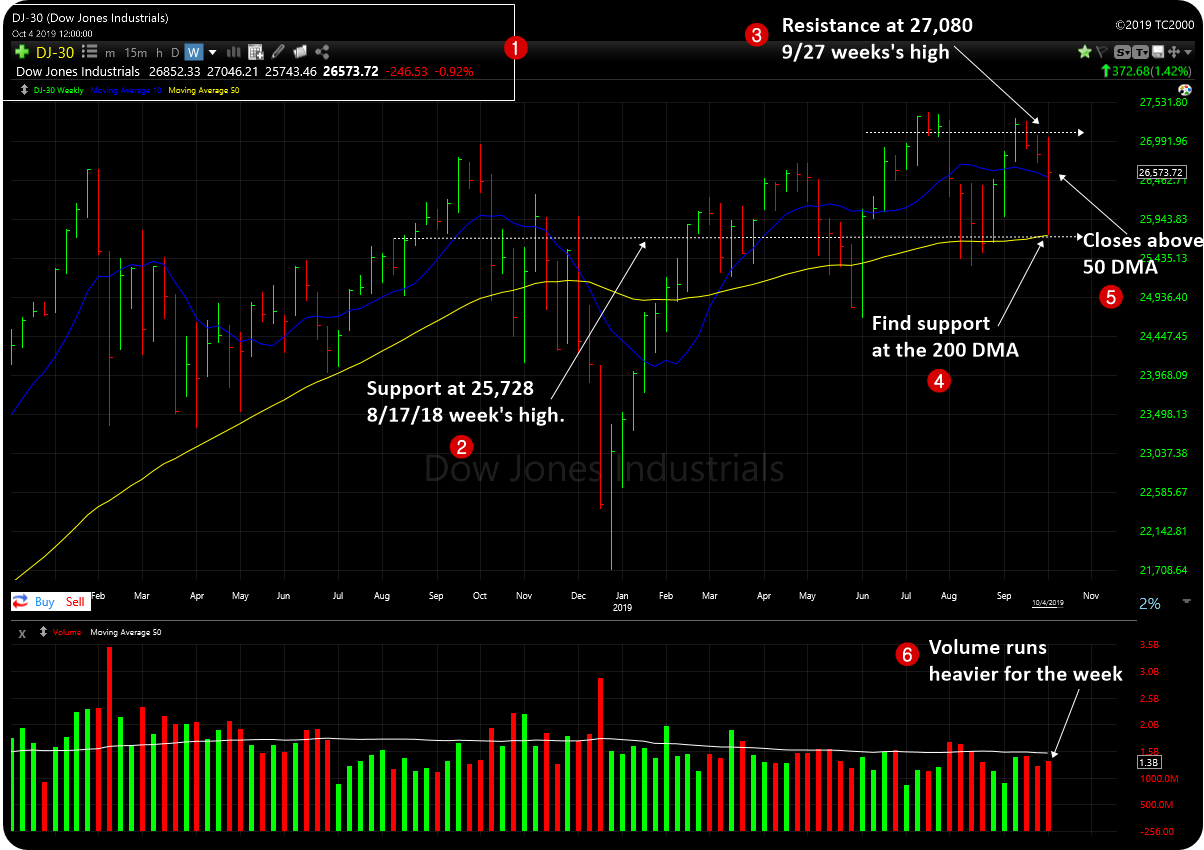
2. Though the index posted less than 1% loss for the week, the support line changed significantly as it had a wild price swing for the week. The support resides around 25,728 which is the 8/17/18 weekending high. It’s also close to the current 200 day moving average line.
3. The resistance changed little bit, though, as it recouped most of the losses. It’s at 27,080 which is the 9/27 weekending high.
4. The index managed to close above the key 50 day moving average line regardless of the wild price swing.
5. The index also successfully tested the 200 day moving average line which is generally considers as a long term support line.
5. The overall trading volume appeared to be came in higher for the week.
Over all the index ended the week with another manageable losses regardless of the wild price swing.
However, the index displayed mixed signals for the week. It ended above the short term 50 DMA support line. It also successfully tested the 200 DMA long term support line. But, the volume picked up pace when the index posted heavy losses on Wednesday. But, the volume didn’t pick up pace when the index recouped the losses in the next two days which can be considered as weakness.
The S&P 500 action was more less matched the Dow Jones. But, the NASADQ’s action showed little bit stronger action for the week, as it’s closed above the 50 DMA support line.
So, as of now, the long term up trend still gets the benefits of the doubt.
Around 14+ stocks posting over 5% gains in the Top Gainers – Growth Stocks Picks, as of this week.
Also do not forget to checkout the Stock Charts Gallery of annotated growth stock charts.