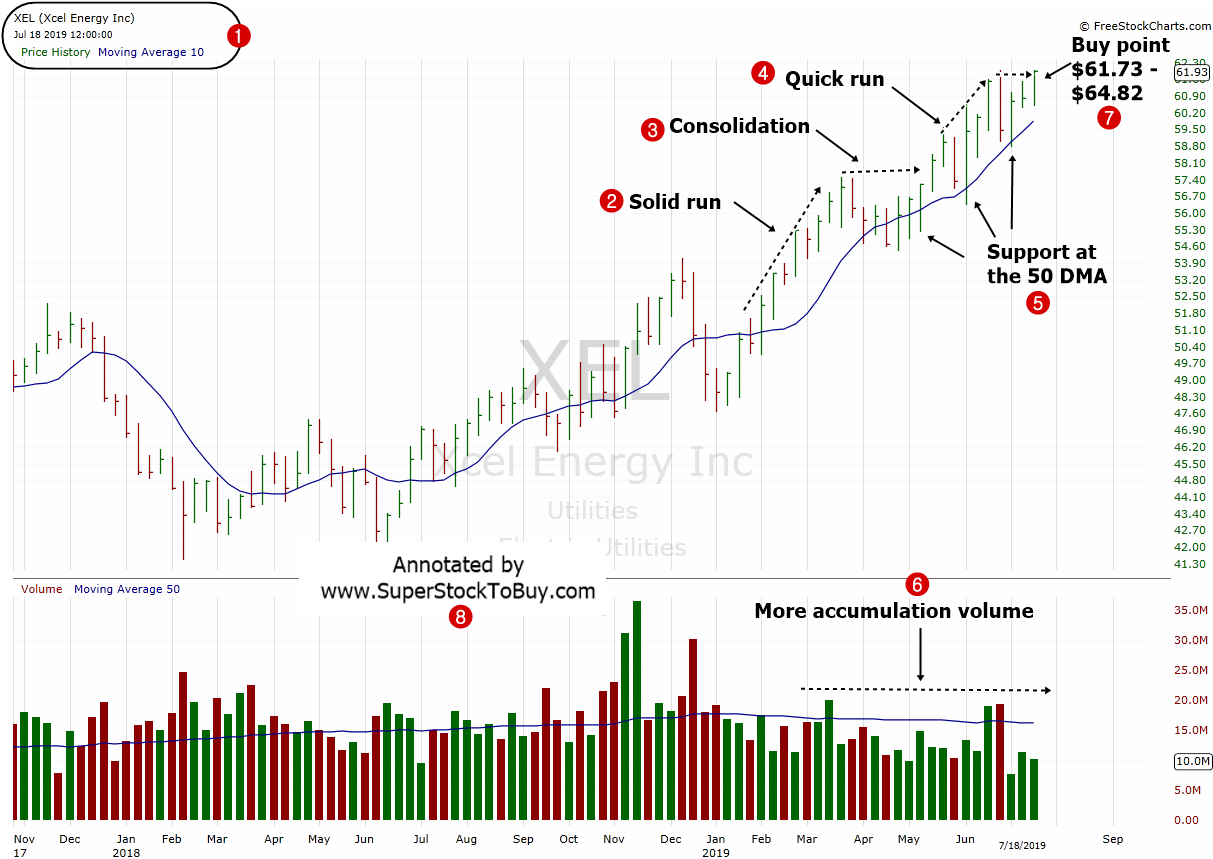
Xcel Energy Inc. ( $XEL )stock is trading litte over 50 dollars as of July 19th , 2019 and offering a possible buying price between $61.73 – $64.82. Let’s look at the stocks technical actions using a weekly chart.

2. The stock had a solid run after coming out of a consolidation in the early February.
3. The stock had a nice consolidation after that.
4. The stock broke out again, and made a quick, but a profitable run.
5. The stock found support at the 50 day moving average line during the consolidation.
6. The stock see more accumulation week, than distribution since the breakout.
7. The stock is offering possible buying price between $61.73 – $64.82, with a stop loss at $56.79.

