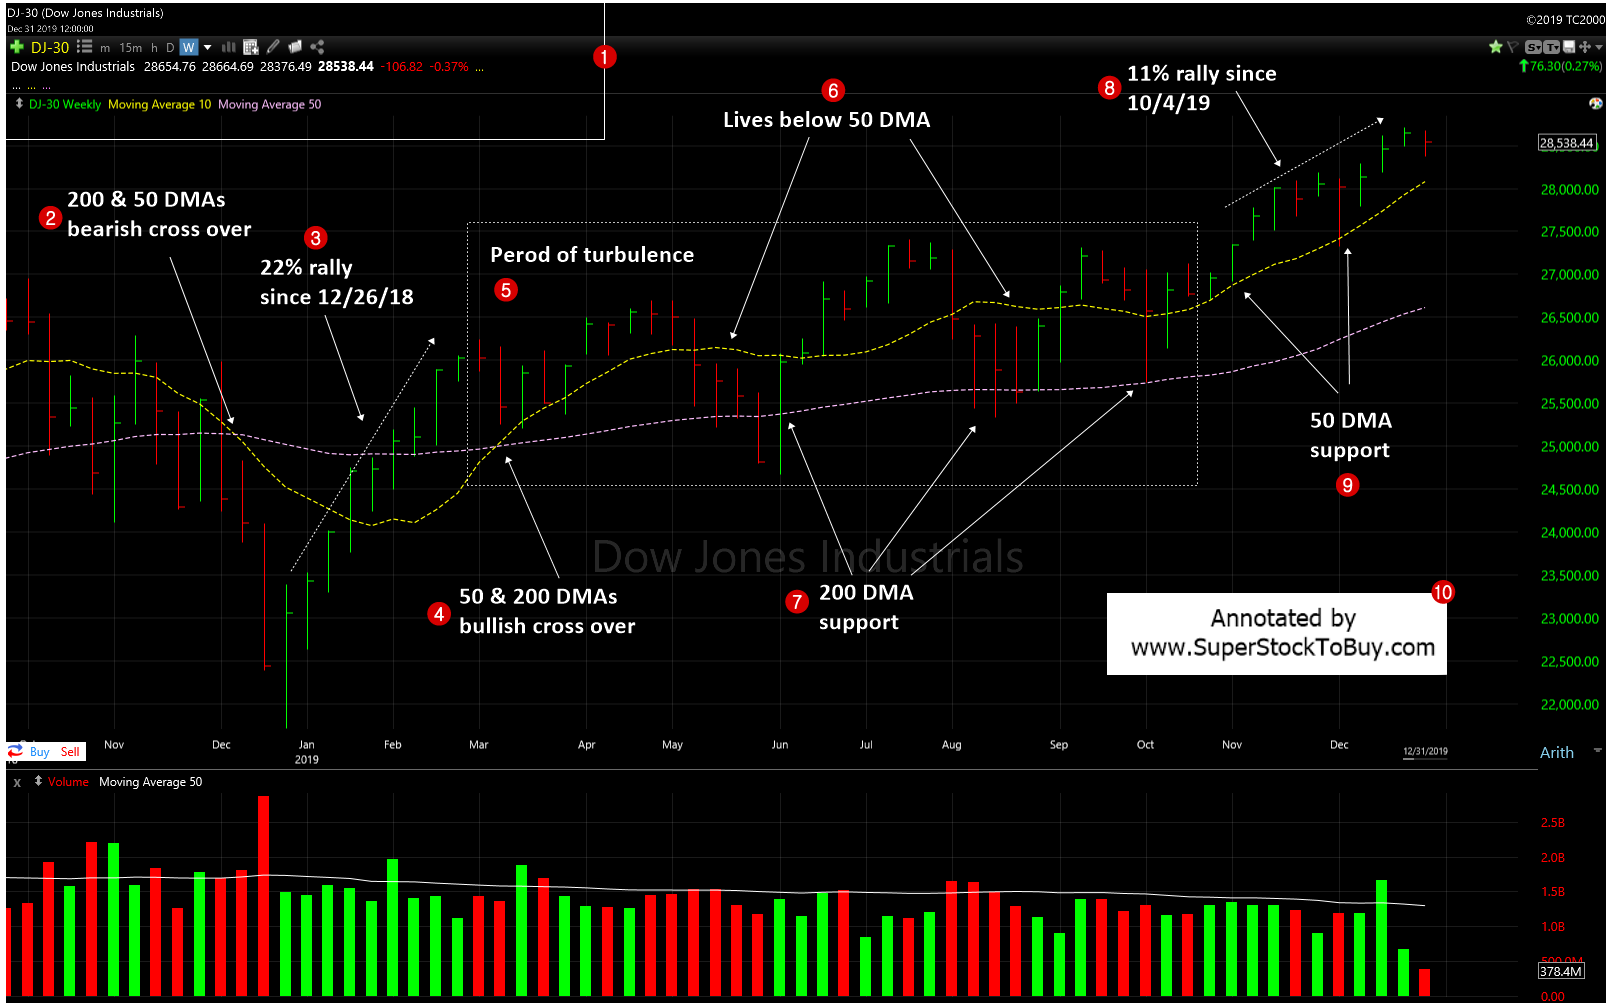
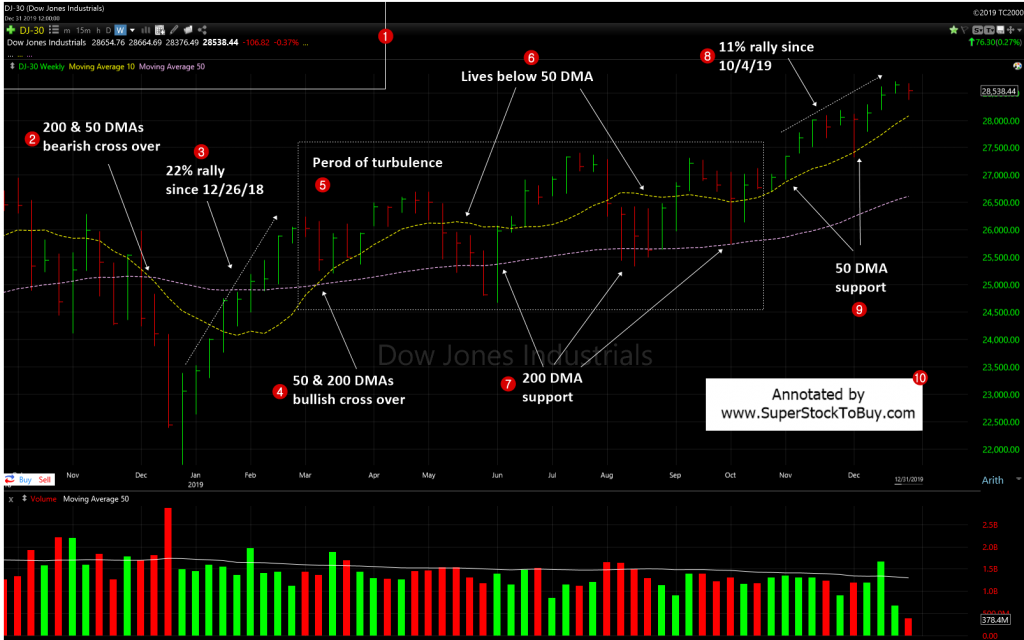
Dow Jones Industrial Average (DJIA) – Let’s look at the index 2019’s technical performance using the weekly chart.
2. The index started the year from a deep hole which was preceded by a 200 & 50 day moving average (DMA) bearish crossover back in mid December, 2018.
3. However the index staged a rock solid bounce back with a 22% gains which ended around end of April.
4. The index also witnessed the 50 & 200 DMAs bullish crossover during the run.
5. Then the index entered into a long and brutal period of turbulence in the summer and fall. There was no meaningful an well established trend for the growth stock traders to trade on.
6. The index came under pressure many times during this period and lost the key short term 50 DMA support.
7. However, it found support at the long term 200 DMA support line.
8. The index staged another rally back in 10/4 and rallied around 11% since then.
9. The index also successfully tested the 50 DMA support the during this current rally.
Overall the index posted 22% gains for the year. It might look pretty rock solid from the outside, but it spent pretty much the 1st quarter on a recovery mode to recoup the 2018 losses and choppy until end of September or so.
The NASDAQ posted rock solid 35% gains for the year and the S&P 500 posted 29% gains.
Overall, the indices entering the new year in a solid footing unlike when it entered in 2019.
2020 looks so promising, as of now. Good luck to you all…!!! Happy trading…!!!!
Around 150+ stocks posting over 5% gains in the Top Gainers – Growth Stocks Picks, as of this week.
Also do not forget to checkout the Stock Charts Gallery of annotated growth stock charts.


