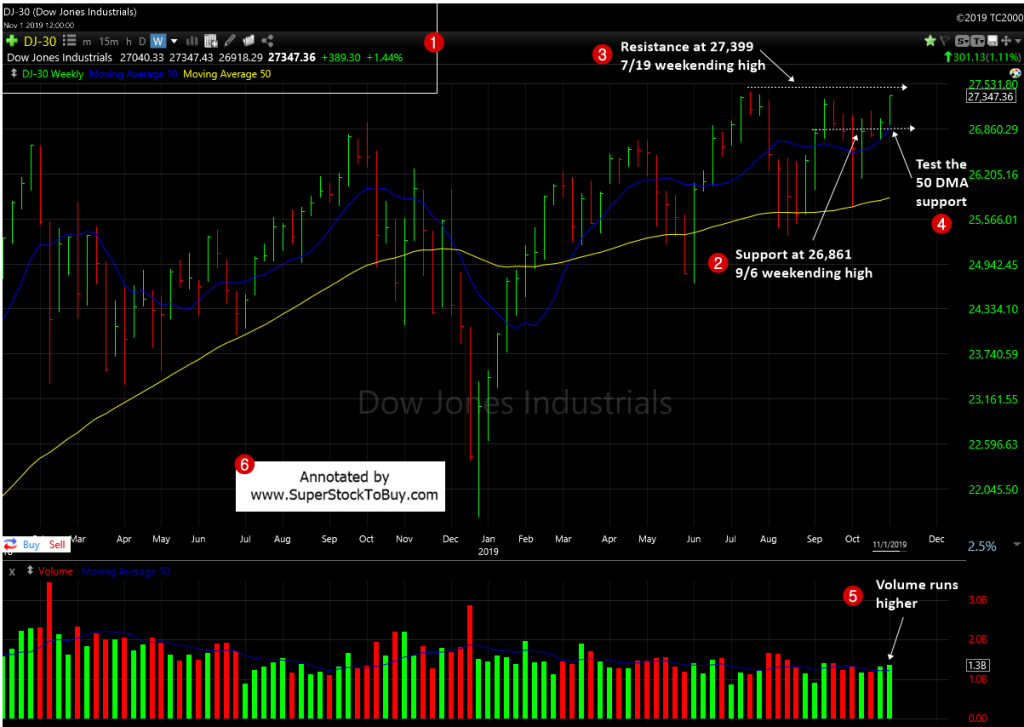
Dow Jones Industrial Average (DJIA) – Let’s look at the index’s key support and resistance analysis for the week of November, 01, 2019, using the weekly chart.

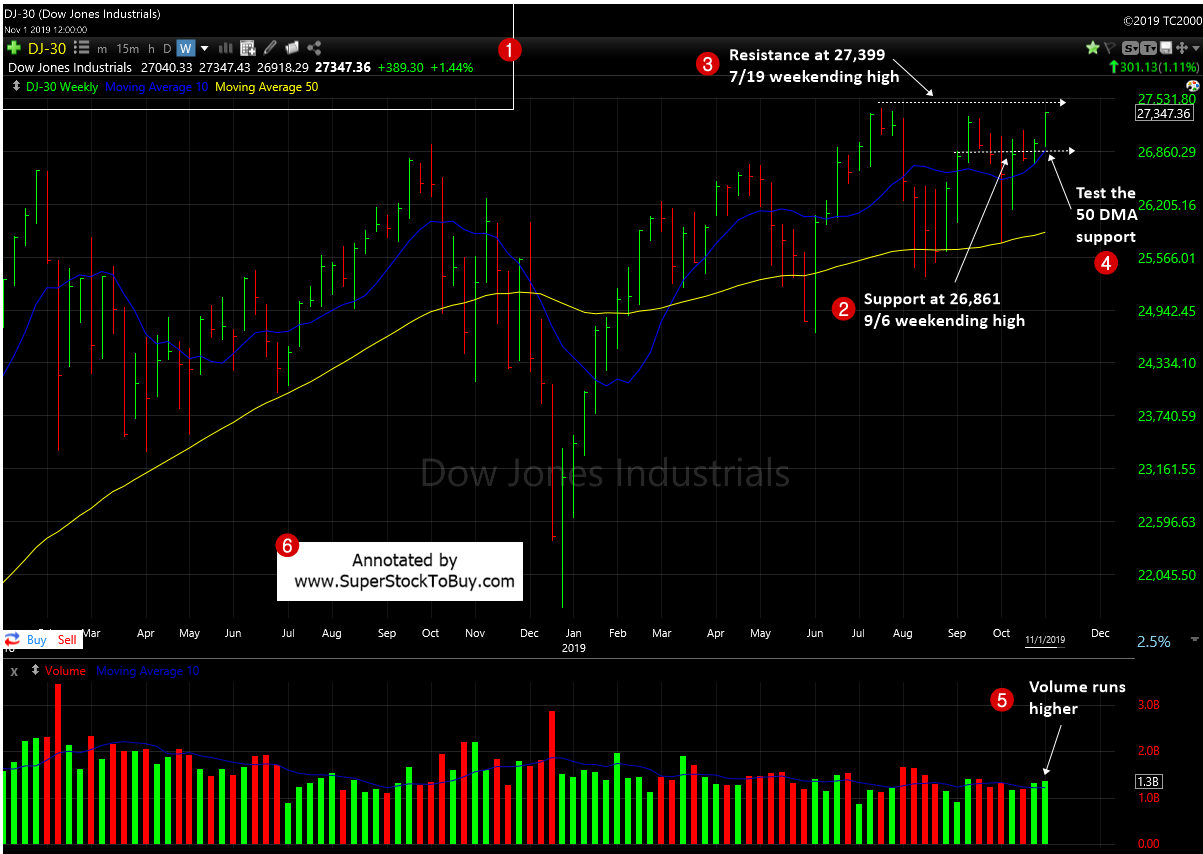
2. The index regained the momentum on Friday and ended the week with nice gains. So, the support resides around 26,861 which is the 9/6 weekending high.
3. The resistance all but reached the top and it’s at 27,399 which is the 7/19 weekending high.
4. The index had a chance to test the 50 day moving average support during the week, and it successfully bounced back after the hitting that briefly.
5. The overall trading volume appear to came in higher for the week.
Over all the index ended week with solid gains. It’s also nice to see the trading volume picked up pace when the index accumulated for the week. It also bounced back from the 50 DMA support.
The NASDAQ and S&P 500 also made decent gains for the week and their chart appears to be strong, as well.
Leading growth stocks over all had a good week, as well, as most of them posted nice gains. Earnings took the toll on some and rewarded many.
So, as of now, the line of least resistance still upwards and let’s see the Dow Jones makes a new all time high. Will it?
Around 62+ stocks posting over 5% gains in the Top Gainers – Growth Stocks Picks, as of this week.
Also do not forget to checkout the Stock Charts Gallery of annotated growth stock charts.


