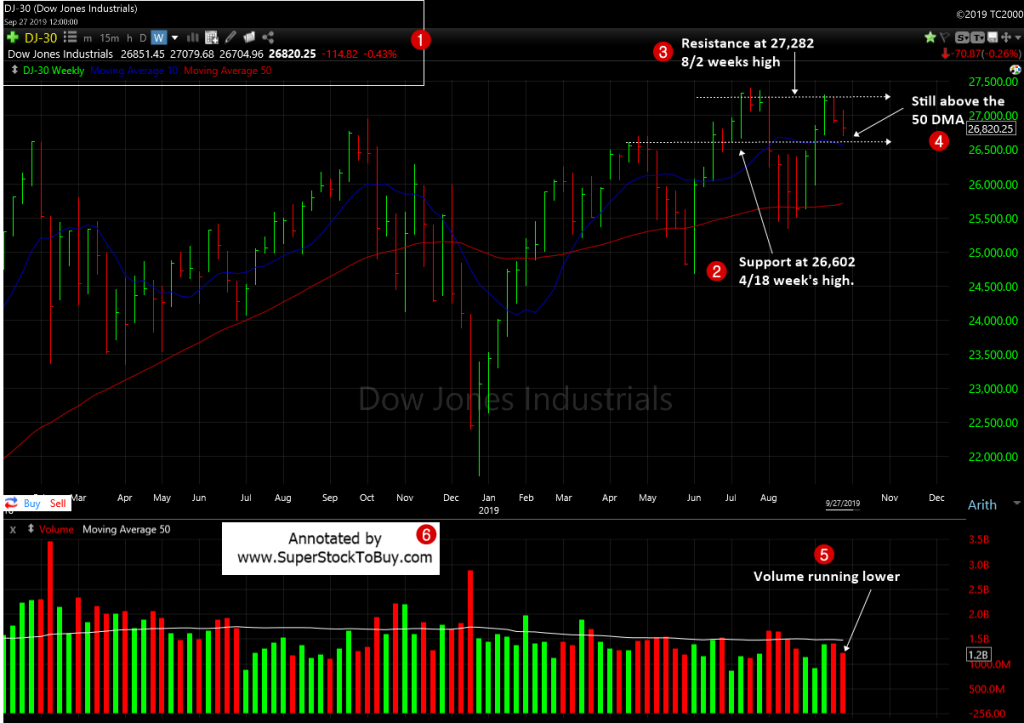
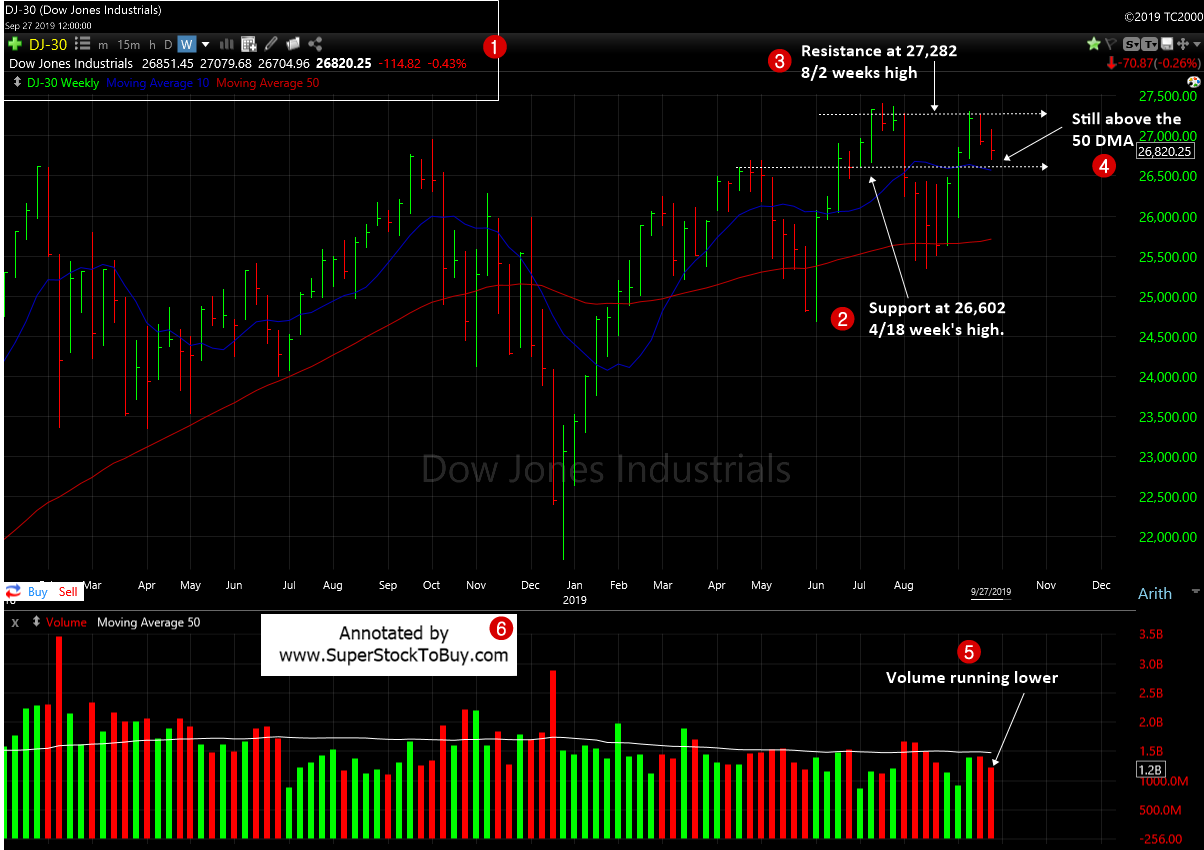
Dow Jones Industrial Average (DJIA) – Let’s look at the index’s key support and resistance analysis for the week of September, 27, 2019, using the weekly chart.

2. Though the index posted little less than 0.5% loss for the week, the support still resides around 26,602 which is the 4/18 weekending high.
3. The resistance changed little bit, though. It’s at 27,282 which is the 8/2 weekending high.
4. The index continue to trade above the key 50 day moving average support line which is a much needed support line, for the current up, but unstable trend to find any meaningful legs.
5. The overall trading volume appear to came in lower for the week.
Over all the index ended the week with another manageable losses. The trading volume receded which is al least a positive sign. The leading growth stocks pretty much stalled for the week. They made some noise, but ended the week pretty much no gains.
The S&P 500 found support at the 50 DMA, but the NASDAQ lost the key support line. Hopefully, NASDAQ is a lagger than the leader towards the downtrend.
Around 16+ stocks posting over 5% gains in the Top Gainers – Growth Stocks Picks, as of this week.
Also do not forget to checkout the Stock Charts Gallery of annotated growth stock charts.


