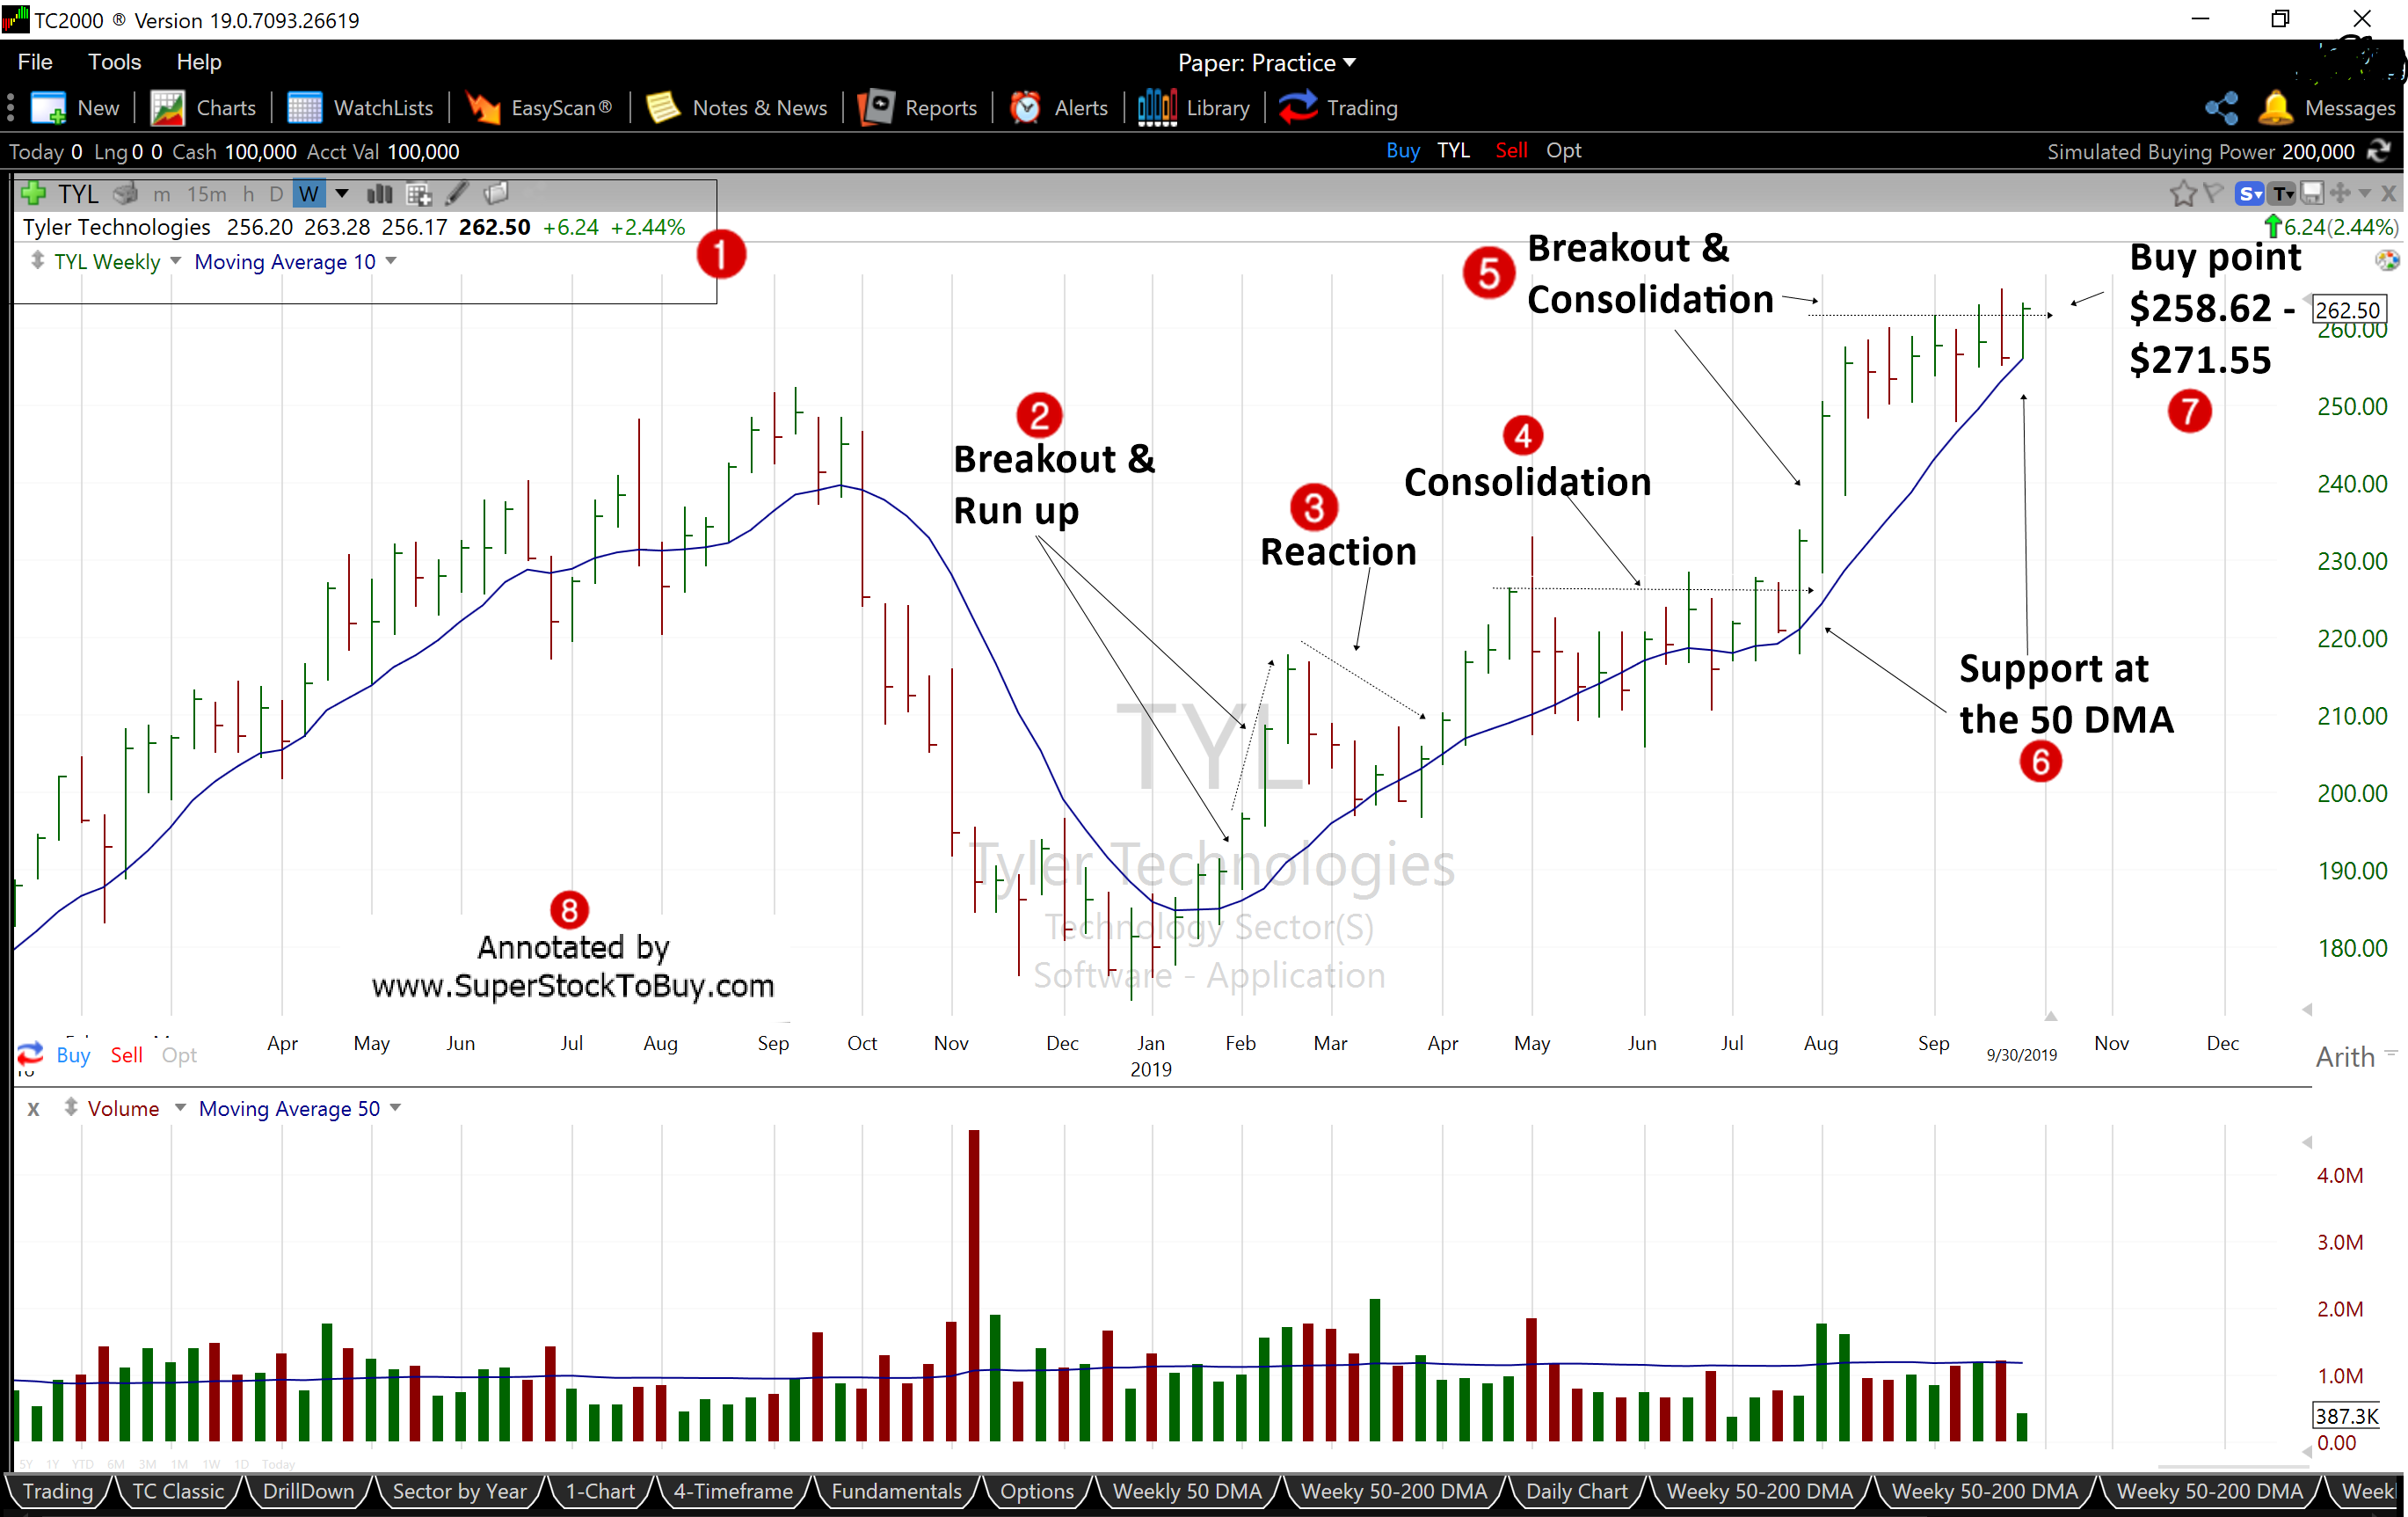
Tyler Technologies Inc. (TYL) – stock is trading around $262.50 dollars as of October, 01, 2019 and offering a possible buying price between $258.62 – $271.55. Let’s look at the stocks technical actions using a weekly chart.

2. The stock breakout back in early February and followed by a quick run.
3. The stock witnessed a quick reaction and pretty much gave up most of the breakout gains.
4. The stock surged little bit, but went into a sideways consolidation mode.
5. The stock staged another rock solid breakout, and pretty much in a consolidation mode since then.
6. The stock also found support at the key 50 day moving average line.
7. The stock is offering possible buying price between $258.62 – $271.55, with a stop loss at $237.93.
This stock is already part of the Stocks Above 100 Dollars pick and performance will be tracked here .
Also do not forget to checkout the Stock Charts Gallery of annotated growth stock charts.

