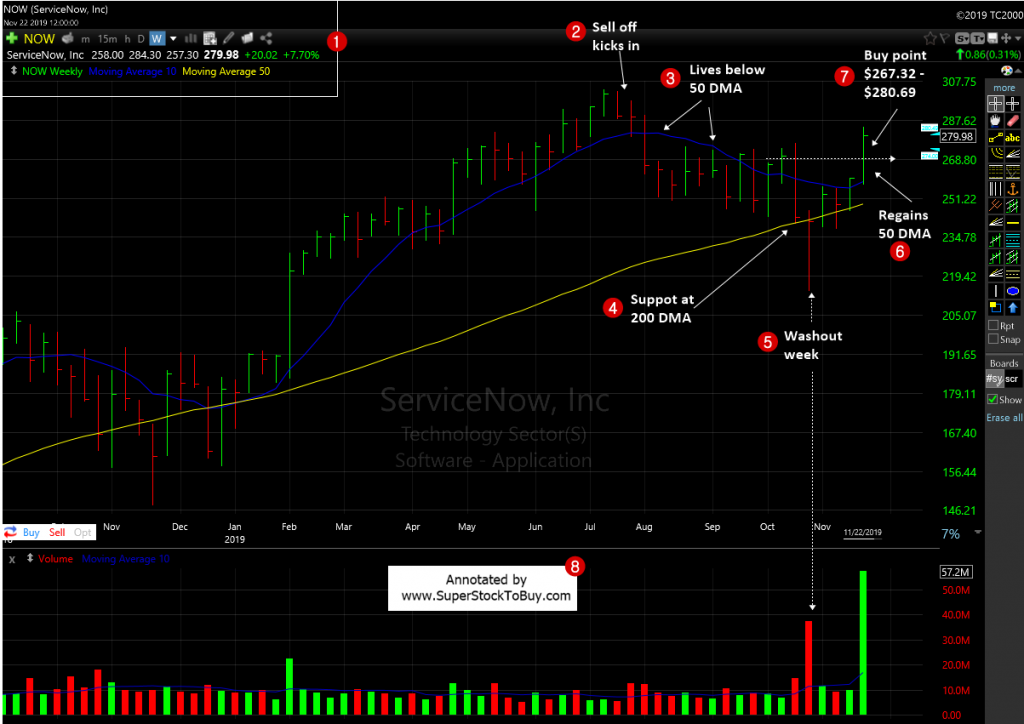
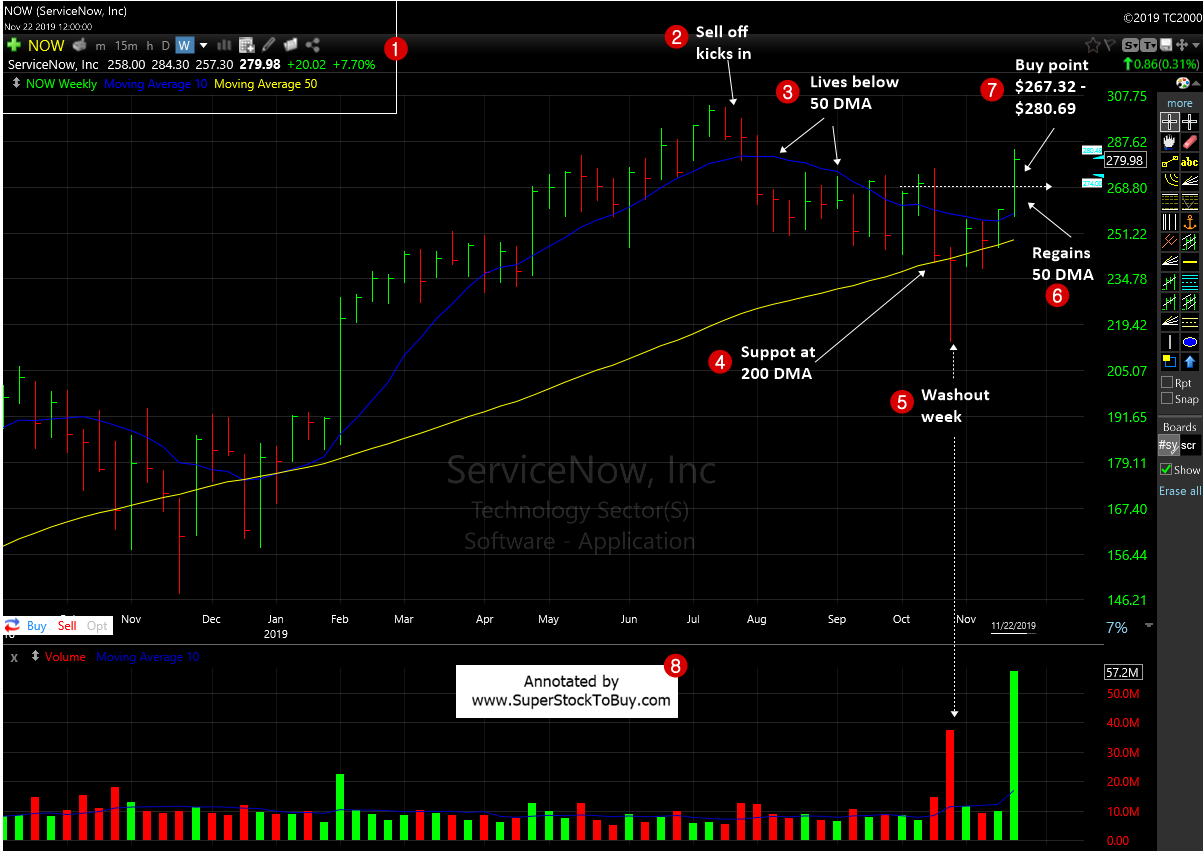
ServiceNow Inc. (NOW) – stock is trading around $279.98 dollars as of November, 25, 2019 and offering a possible buying price between $267.32 – $280.69. Let’s look at the stocks technical actions using a weekly chart.

2. After a rock solid run up, the stock started to recede back in mid July.
3. The stock also lost support at the 50 day moving average (DMA), and started to live below that line.
4. However, the stock found support at the 300 DMA, though.
5. The stock also gave up the 200 DMA, but closed on that line after staging a so call washout week i.e. when a stock comes under severe selling pressure, but still ends at the top end of the range.
6. The stock also regained the 50 DMA lately.
7. The stock is offering possible buying price between $267.32 – $280.69, with a stop loss at $245.93.
This stock is already part of the Stocks Above 100 Dollars pick and performance will be tracked here .
Also do not forget to checkout the Stock Charts Gallery of annotated growth stock charts.


