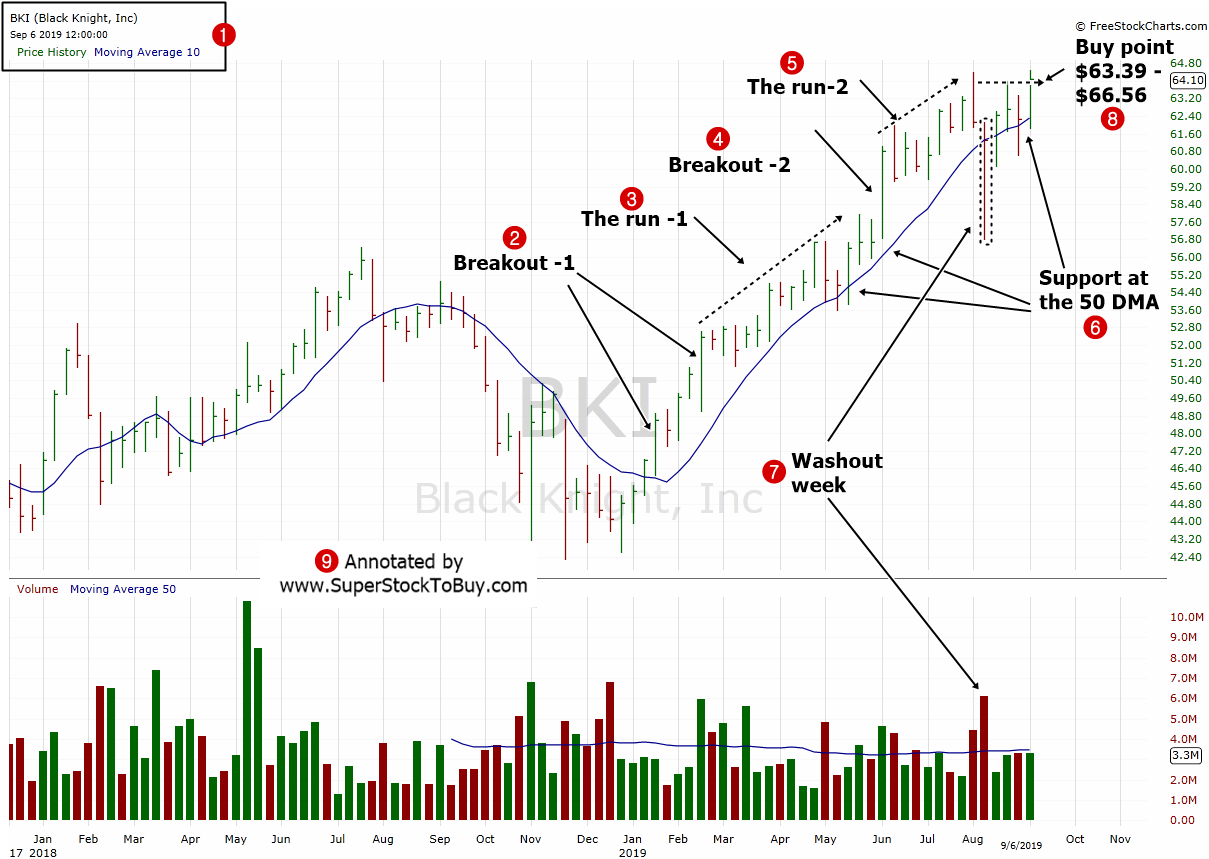
Black Knight Inc. (BKI) – stock is trading around $64.10 dollars as of September, 08, 2019 and offering a possible buying price between $63.39 – $66.56. Let’s look at the stocks technical actions using a weekly chart.

2. The stock breakout in mid January – February time frame.
3. The stock had a great run after that.
4. After couple of weeks of tight trading, the stock brokeout, again.
5. The stock had a quick, but nice run after that.
6. The stock found support at the 50 day moving average line, all along.
7. The stock also witnessed a washout week, during the recent 50 DMA, test.
8.The stock is offering possible buying price between $63.39 – $66.56, with a stop loss at $58.32.
This stock is already part of the Stocks Under 100 Dollars pick and performance will be tracked here .

