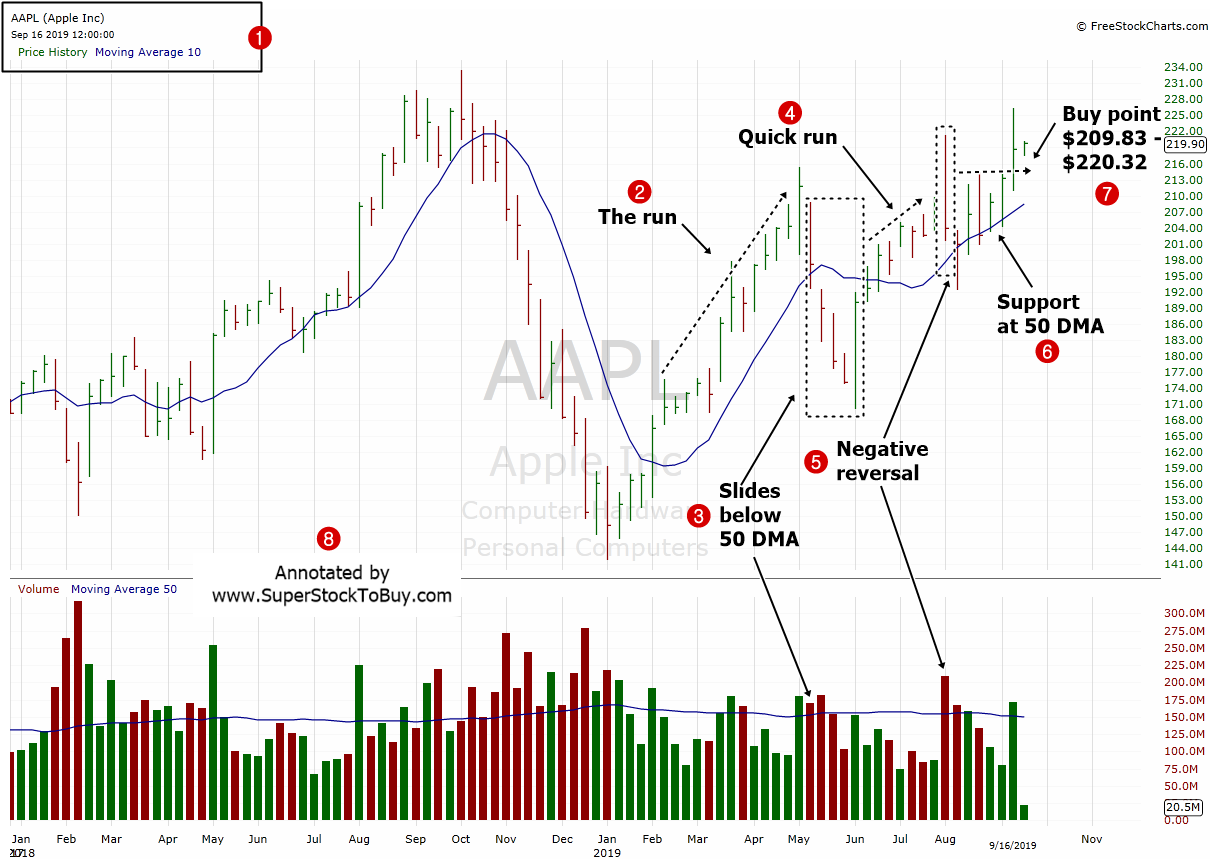
Apple Inc. (AAPL) – stock is trading around $219.90 dollars as of September, 17, 2019 and offering a possible buying price between $209.83 – $220.32. Let’s look at the stocks technical actions using a weekly chart.

2. The stock breakout in early February after a steep and long decline and had a nice run followed by that.
3. Then the stock slided and gave up almost all the gains. It’s even dived well below the 50 day moving average.
4. Then the stock bounced and made a quick run.
5. Then the stock staged a negative reversal on heavier volume, but managed to hang on to the 50 DMA line, this time.
6. The stock continued the support at the 50 DMA as it edged up.
7. The stock is offering possible buying price between $209.83 – $220.32, with a stop loss at $193.04.
This stock is already part of the Stocks Above 100 Dollars pick and performance will be tracked here .
Also do not forget to checkout the Stock Charts Gallery of annotated growth stock charts.

