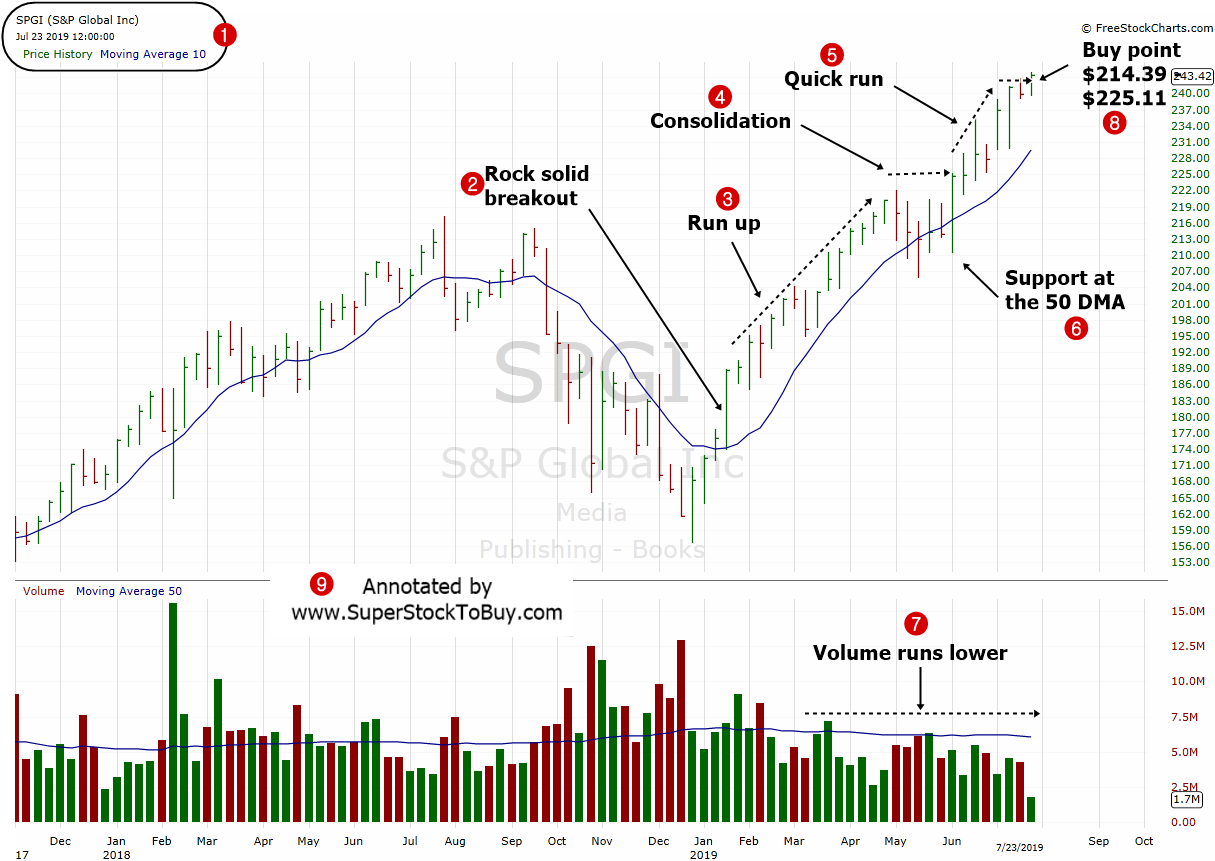
S&P Global Inc. ( $SPGI ) stock is trading under 250 dollars as of July 24nd , 2019 and offering a possible buying price between $214.39 – $225.11. Let’s look at the stocks technical actions using a weekly chart.

2. The stock broke out in a solid volume in early January.
3. The stock had a solid run after that.
4. The stock consolidated the gains for few weeks after that.
5. The stock made a quick run after that.
6. The stock also found support at the 50 day moving average.
7. The volume is running lower though lately, which is a little concern.
8. The stock is offering possible buying price between $214.39 – $225.11, with a stop loss at $197.24.

