In this article, we will see the “Three week tight” one of the bullish chart pattern. We will cover
- What is it?
- Signal it sends?
- How to use it?
- Why I like it.
What is three week tight chart pattern?
It’s one of the bullish chart pattern forms when a stock closes in a tight range (ideally +/- 1% from the previous week’s close) for few weeks, at least for three weeks after witnessing a huge breakout on heavier volume.
Signal it sends?
It may indicate the previous huge breakout is not just a flash in the pan. So, the chances of giving up those gains are very unlikely. During the tight formation, the volume generally dries up indicating not many people are ready to sell or buy.
How to use it?
One can consider taking a long position in a stock as soon as it clears the tight consolidation.
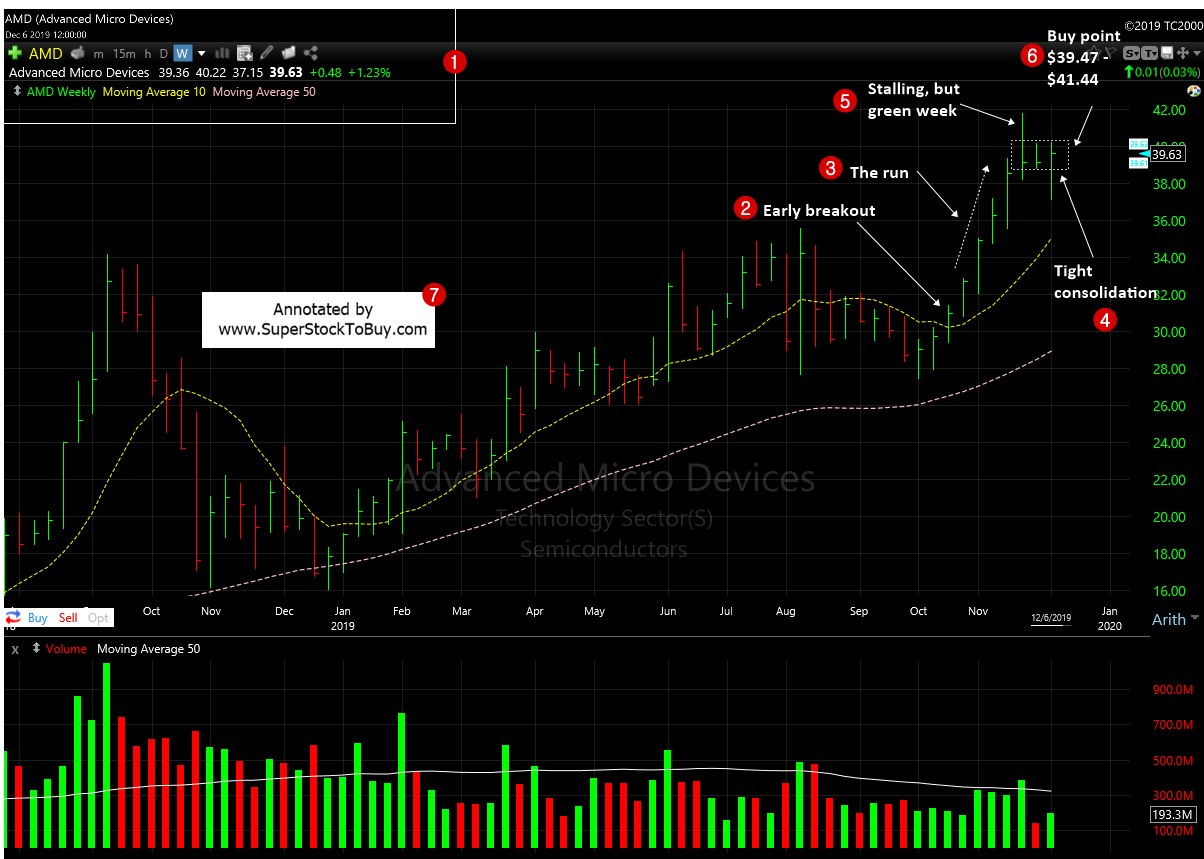
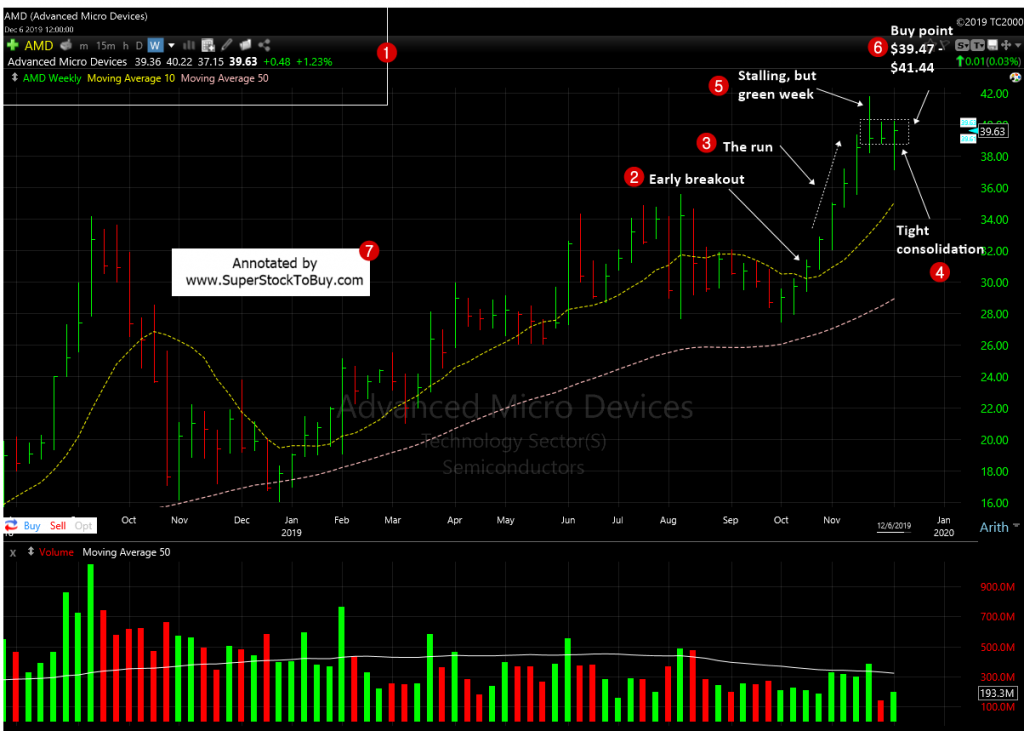
In the example below AMD’s original buy point was around $30.90 – $32.45 when in bounced from the 50 DMA support back in October, 2019. Once, it cleared the buy point, the stock witnessed a not stop run and formed a tight weekly closing pattern and offered the secondary buy point around $39.47 – $41.44 in December. The stock rallied nicely since then.
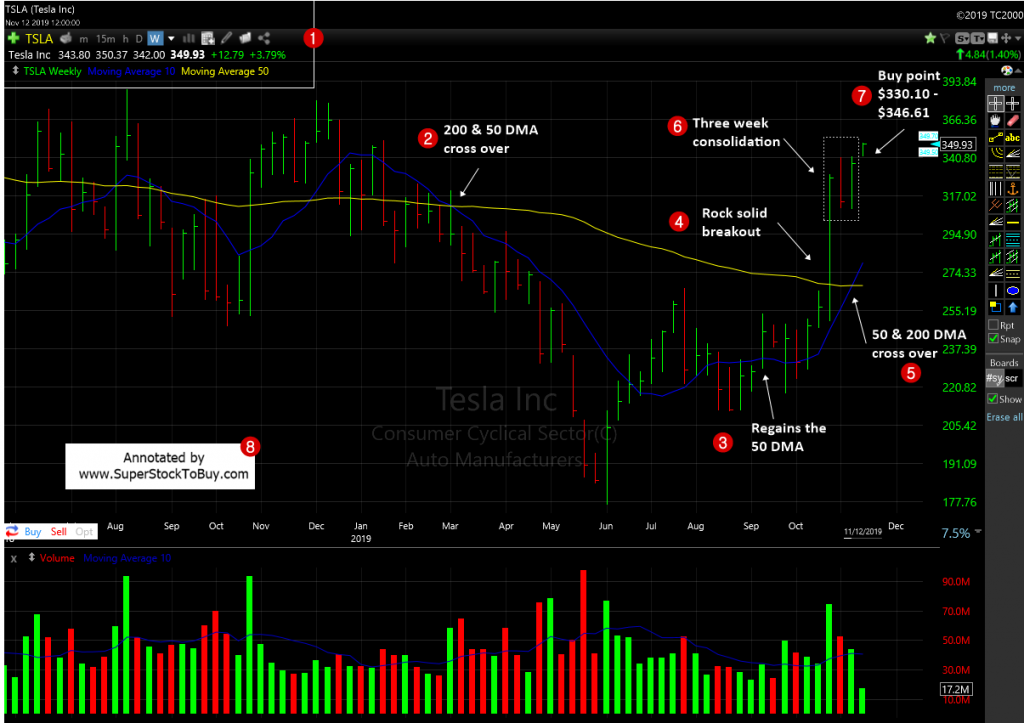
Here is another example. The monster TSLA. The ideal buy point would have been around $264. But, the breakout was so powerful, one might not have got a chance to caught the buy point as it gapped up. But, the stock witnessed couple of weeks of tight closing and offered a buy point around $330.10 – $346.61. It rallied to $595 since then.
Exceptions:
The tight pattern doesn’t have to be three weeks or more. It can be just a week or two as well.
Ideally the tight closing range should be within +/- 1% from the previous week’s closing. But, it can be loose at sometimes. You are just looking for a tight chart pattern.
Why I like it.
Ideally, I like the 50/200 DMA bounce. So, if you miss it during the bounce, the ideal case is wait for the stocks to test the 50/200 DMA to enter it gain. But, this one of the reliable chart pattern that may form before the stock caught up with the 50 DMA support and present an opportunity to take long position in a stock.


