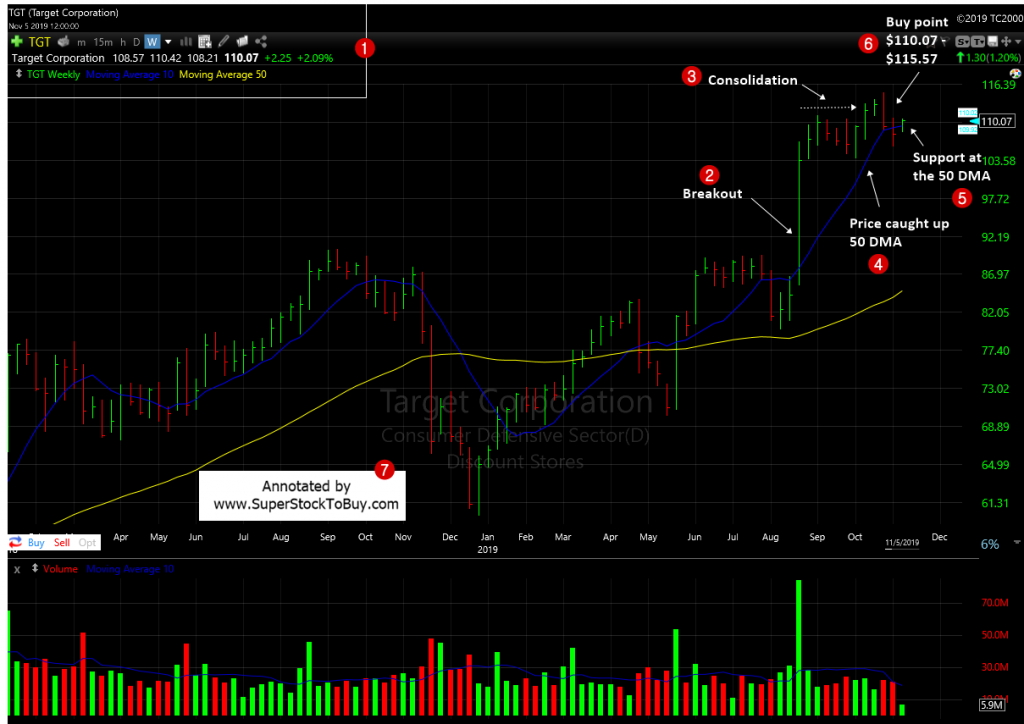
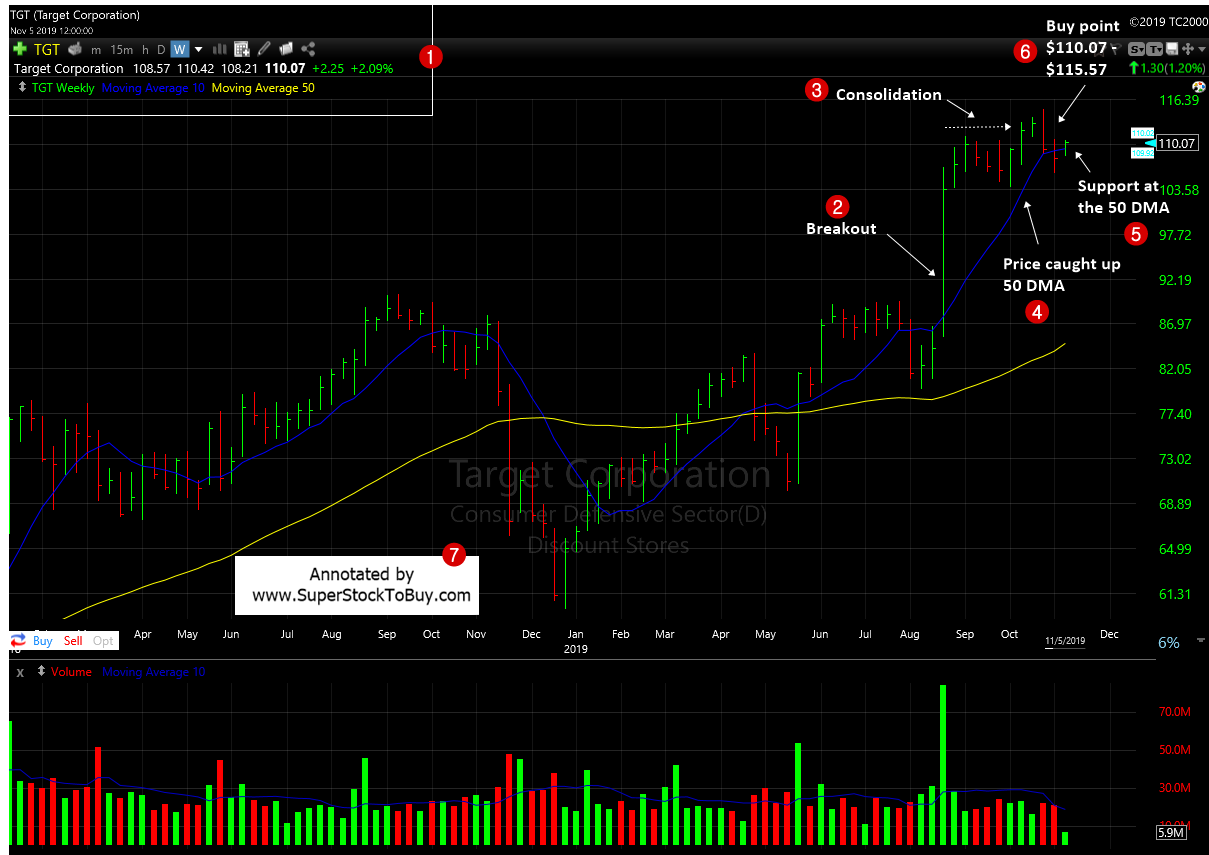
Target Corporation (TGT) – stock is trading around $110.06 dollars as of November, 06, 2019 and offering a possible buying price between $110.07 – $115.57. Let’s look at the stocks technical actions using a weekly chart.

2. The stock staged a rock solid breakout back in August after posting strong quarterly results.
3. Then the stock moved pretty much sideways and consolidated the gains.
4. As the breakout was a big gap up, this consolidation helped the stock’s price to catch up with the 50 day moving average ( DMA).
5. Though the stock dived below the 50 DMA recently, it quickly recovered it.
6. The stock is offering possible buying price between $110.07 – $115.57, with a stop loss at $101.26.
This stock is already part of the Stocks Above 100 Dollars pick and performance will be tracked here .
Also do not forget to checkout the Stock Charts Gallery of annotated growth stock charts.


