In this article, we will focus on a stock’s 50 and 200 day moving averages (DMAs) at very high level. We will cover:
- What are they?
- Signals they send?
- How to use them?
- Why I like them?
What Is a Simple Moving Average (SMA)?
A simple moving average (SMA) is an arithmetic moving average calculated by adding recent closing prices and then dividing that by the number of time periods in the calculation average. Please go ahead read this article from Investopedia for more details.
*** We will refer SMA as DMA in this article.
What are 50 & 200 DMAs?
Though there are many moving averages ( 5 day, 7 day, 20 day…etc.) one can use it for their different trading style, we will just focus on the 50 and 200 DMAs as they are widely used by the big instructional investors to speculate the direction of a stock movement.
Signals they send?
Here is the high level core signals they generally send:
| 1. Stock trading above the 50 DMA | Short term bullish upward move |
| 2. Stock trading below the 50 DMA | Short term bearish downward move |
| 3. Stock trading above the 200 DMA | Long term bullish upward move |
| 4. Stock trading below the 200 DMA | Long term bearish downward move |
How to use them?
50 Day moving average and short term trading:
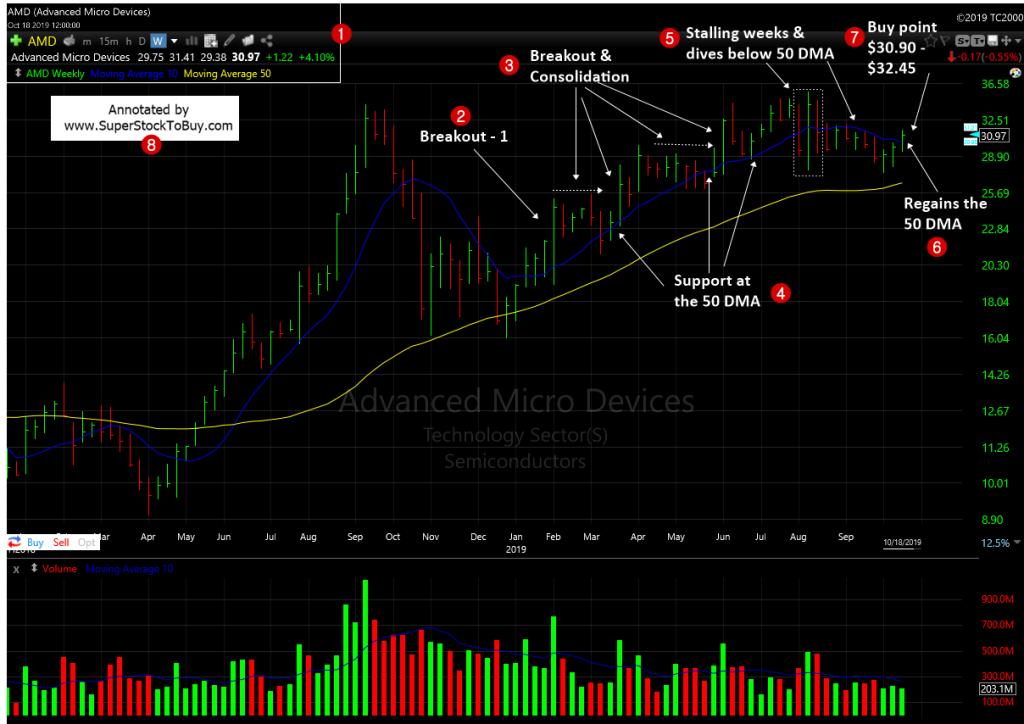
- Bullish: You may consider buying a stock when it finds sound support at the 50 DMA and moves higher from that line. You may want buy as close as to the 50 DMA line. In the example below, AMD reigned the 50 DMA back in October 2019 (#6) and rallied over 60% since then.
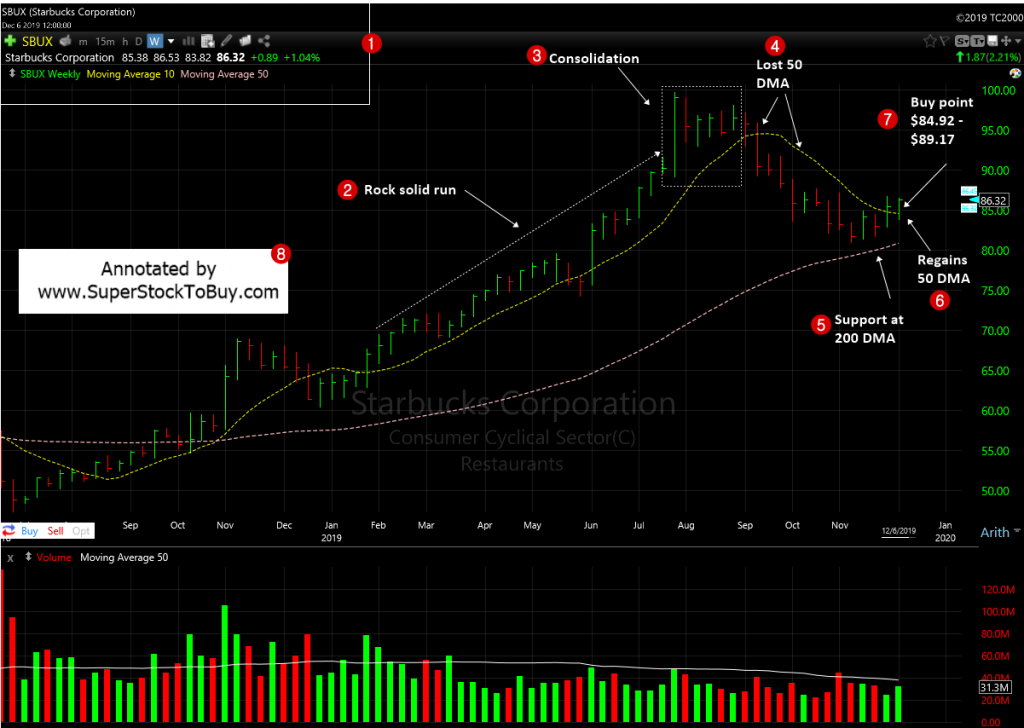
2. Bearish: You may want to consider selling a stocks when it doesn’t find sound support at the 50 DMA and moves lower from that line. You may want to sell it little lower than the 50 DMA line. In the example below, SBUX lost the 50 DMA support and broke down below the line back in September, 2019 (#4). It’s a good time to get out and wait for the short term downtrend to runs its course.
200 Day moving average and long term trading:
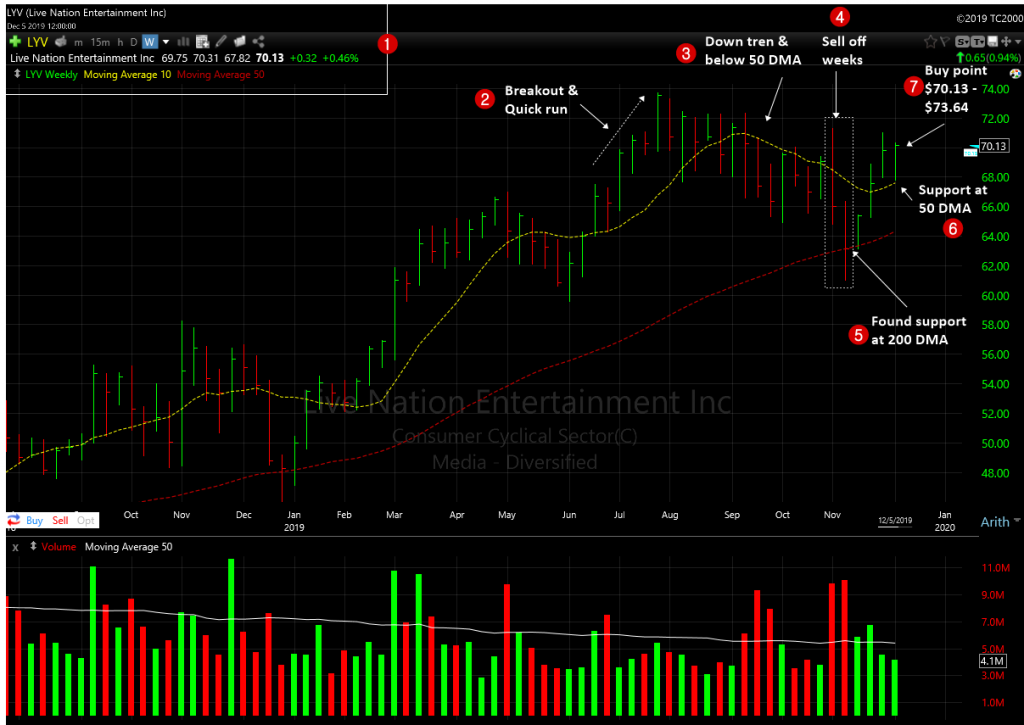
3.Bullish: You can consider buying a stock when it finds sound support at the 200 DMA and moves higher from the line. You may want buy as close as to the 200 DMA line. In the example below, LYV found support at the 200 DMA ( #5) and if you are a long term player, you can consider get in around that point.
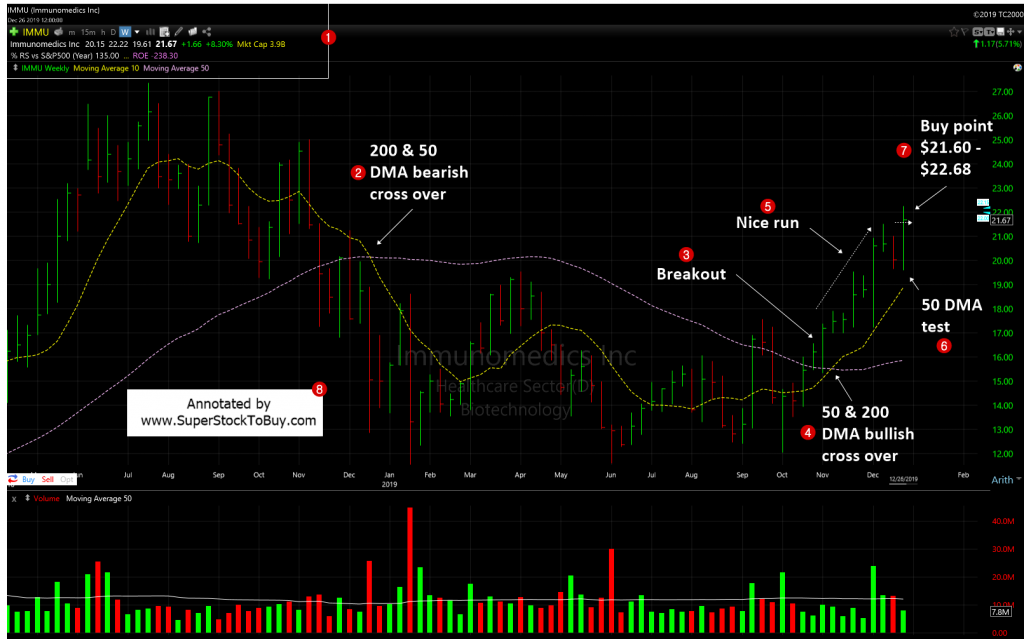
2. Bearish: You may want to consider selling a stocks when it doesn’t find sound support at the 200 DMA and moves lower from that line. You may want to sell it little lower than the 200 DMA line. In the example below IMMU lost the 200 DMA support at point #2. So, if you are a long term player, it’s a good time to get out and step aside and let the downtrend to run the course.
What if the prediction fails?
When speculating in the stock market, the only opinion matter is the stock’s action itself. So, in case these signals fail, cut your losses short. You can start trimming at when your trade shows -5% loss and no more than -8%.
Why I like them:
After reading and following all the chart patterns and technical indicators, all I learned is that just keep the things simple and stupid. Most of the bullish/bearish chart patterns (should) form around these support lines, anyways. These indicators proven to be more reliable. So, just follow these lines, it might very well work for you…!!!
Also do not forget to checkout the Stock Charts Gallery of annotated growth stock charts and Top Gainers – Growth Stocks Picks that are posting over +5% gains.


