

Dow Jones Industrial Average (DJIA) – Let’s look at the index’s key support and resistance analysis for the week of February, 21, 2020, using the weekly chart.
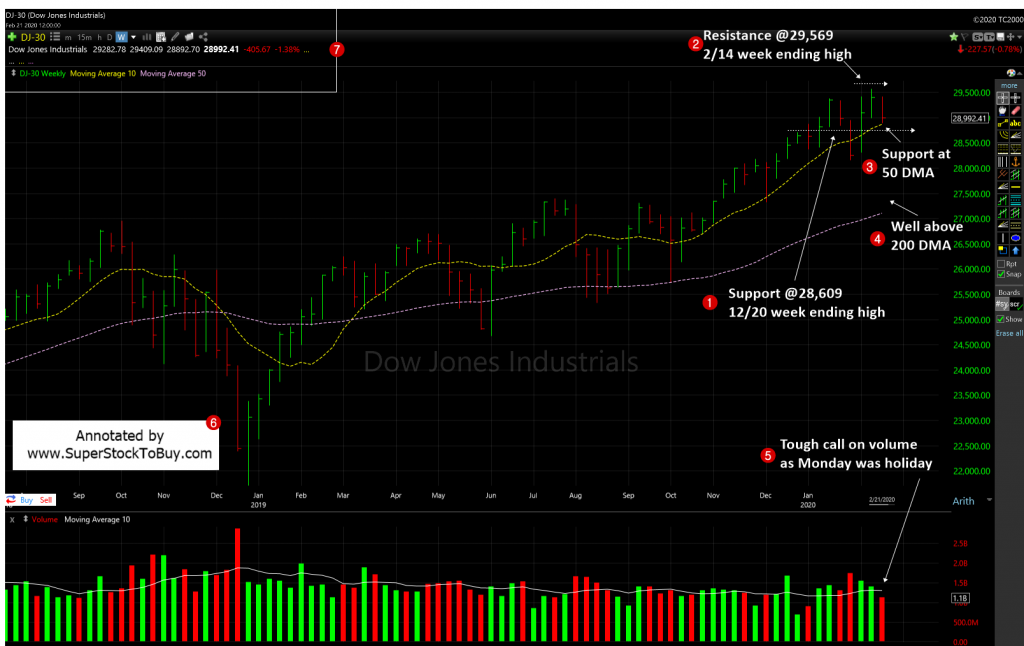
1. Though the index posted noticeable loss for the week, the support remains at 28,609 which is the 12/20 week ending high.
2. As the index failed to make any new high, the resistance remains at 29,569 which is the 2/14 week ending high.
3. The index found support at the short term 50 day moving average (DMA) support line.
4. The index continues to trade well above the 200 DMA, the long-term support line.
5. The volume came in lower than last week levels. A s Monday was a holiday, it’s challenging to compare the volume with last week’s level.
The index gave up all last week’s gain. It also logged couple of distribution days. However, it still managed to find support at the key 50 DMA line.
The S&P 500 posted -1.25% loss and the NASDAQ posted around -1.6% loss. Both logged couple of distribution days, as well. However, they are still trading well above the key 50 DMA line. Mega cap growth stocks, such as MSFT, APPL and AMD came under severe distribution, as well.
So the uptrend, which is started the week of 10/4/19 is back undress pressure, now. So be cautious with any new buys, lock in the profits as needed and cut your losses short.
Around 201+ stocks posting over 5% gains in the Top Gainers – Growth Stocks Picks, as of this week.
Also do not forget to checkout the Stock Charts Gallery of annotated growth stock charts.
Snapshot of indices performance since 10/4 lows.
| Start | End | Diff (%) | From 52 week high | YTD (%) | |
| Dow | 25,743.46 | 28,992.41 | 12.62 | -1.95 | 1.59 |
| NASDAQ | 7,700.00 | 9,576.59 | 24.37 | -2.66 | 6.73 |
| S&P 500 | 2,855.94 | 3,337.75 | 16.87 | -1.64 | 3.31 |
Previous week chart:
