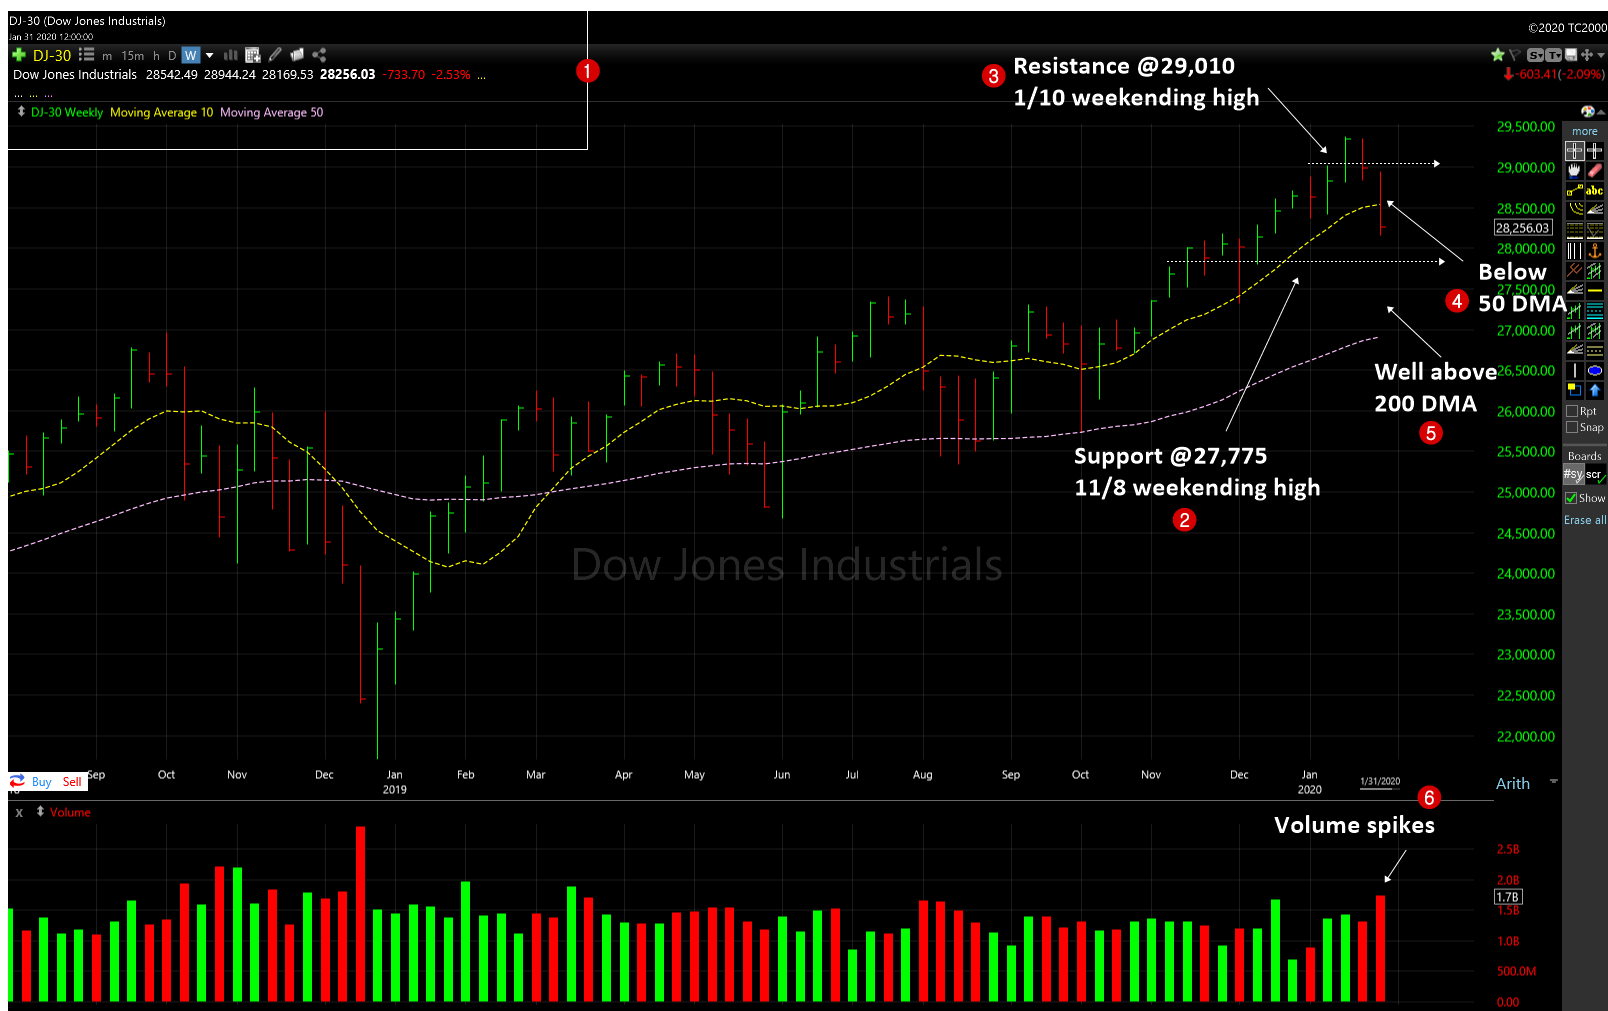
Dow Jones Industrial Average (DJIA) – Let’s look at the index’s key support and resistance analysis for the week of January, 31, 2020, using the weekly chart.

2. As the index lost ground and posted heavy losses, the support has moved to 27,775 which is the 11/8 weekending high.
3. The resistance moved to 29,010 which is 1/10 weekending high.
4. The index also lost the short term 50 day moving average (DMA) support line, this week. The last time it lost this support line is back in August 1st week.
5. It continues to trade well above the 200 DMA, the long-term support line, though.
6. The volume came in heavier than last week.
The index posted over -2.5% losses for the week. The Friday’s action was also like a distribution day. The index also turned negative for the year with -1% loss.
The S&P 500 posted over -2% loss, but ended on the 50 DMA support line. The NASDAQ posted less than -2% loss and ended above the 50 DMA line. The mega cap growth stocks such as FB, APPL lost too much ground. Some leaders like MSFT, AMZN survived and held on to their gains.
So, uptrend which is started the week of 10/4/19 is under pressure now. Few more distribution days may kill the rally. So, please be cautious with new buys, cut your losses and don’t hesitate to lock in your profits.
Around 157+ stocks posting over 5% gains in the Top Gainers – Growth Stocks Picks, as of this week.
Also do not forget to checkout the Stock Charts Gallery of annotated growth stock charts.
Snapshot of indices performance since 10/4 lows.
| Start | End | Diff (%) | YTD (%) | |
| Dow | 25,743.46 | 28,256.03 | 9.76 | -0.99 |
| NASDAQ | 7,700.00 | 9,150.94 | 18.84 | 1.99 |
| S&P 500 | 2,855.94 | 3,225.52 | 12.94 | -0.16 |
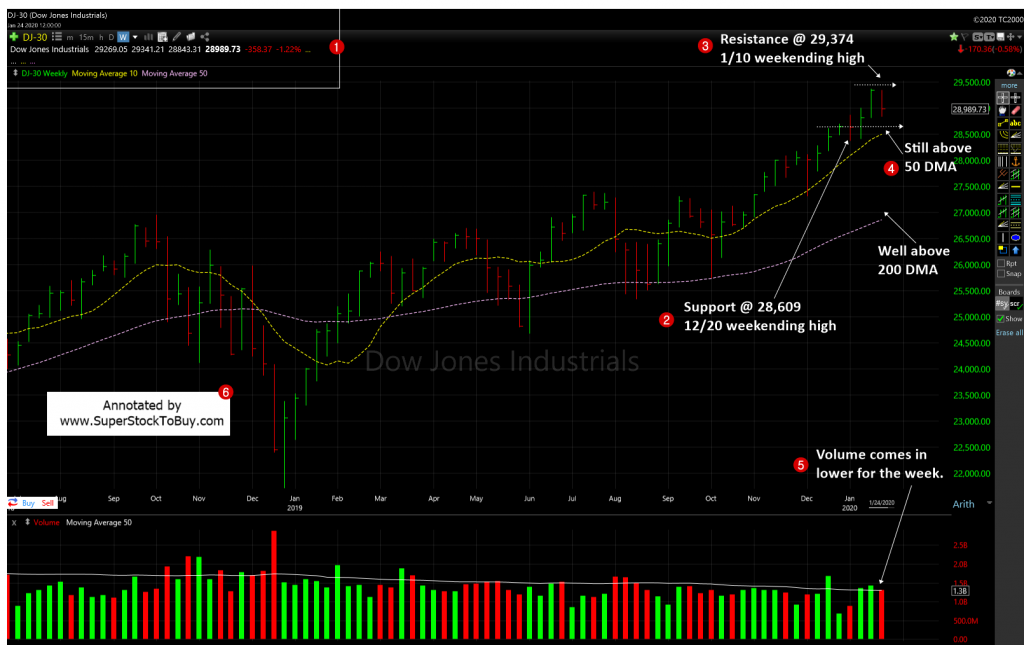
Previous week chart: