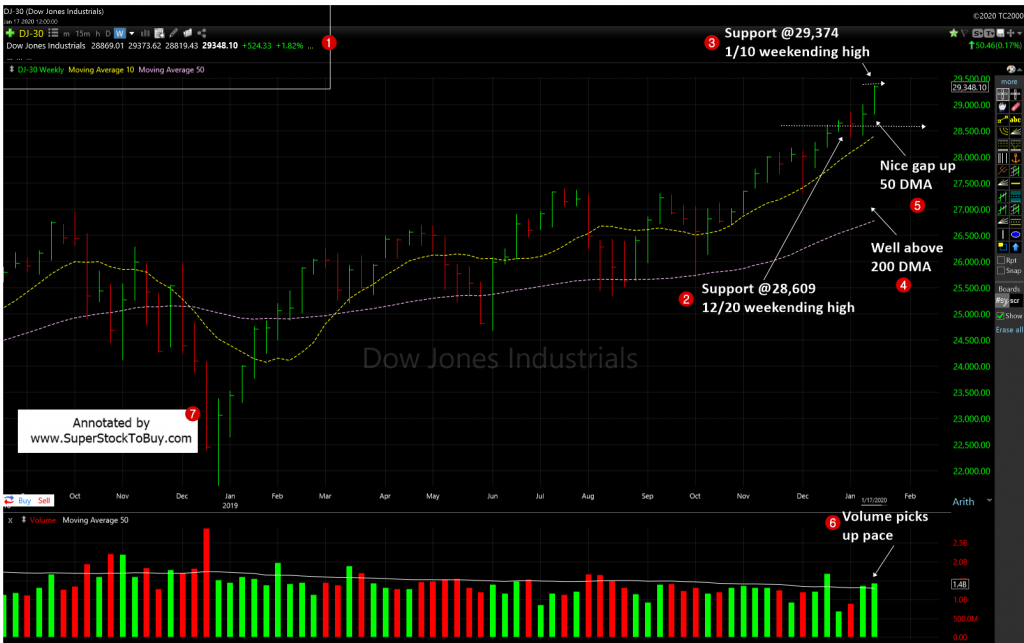
Dow Jones Industrial Average (DJIA) – Let’s look at the index’s key support and resistance analysis for the week of January, 24, 2020, using the weekly chart.
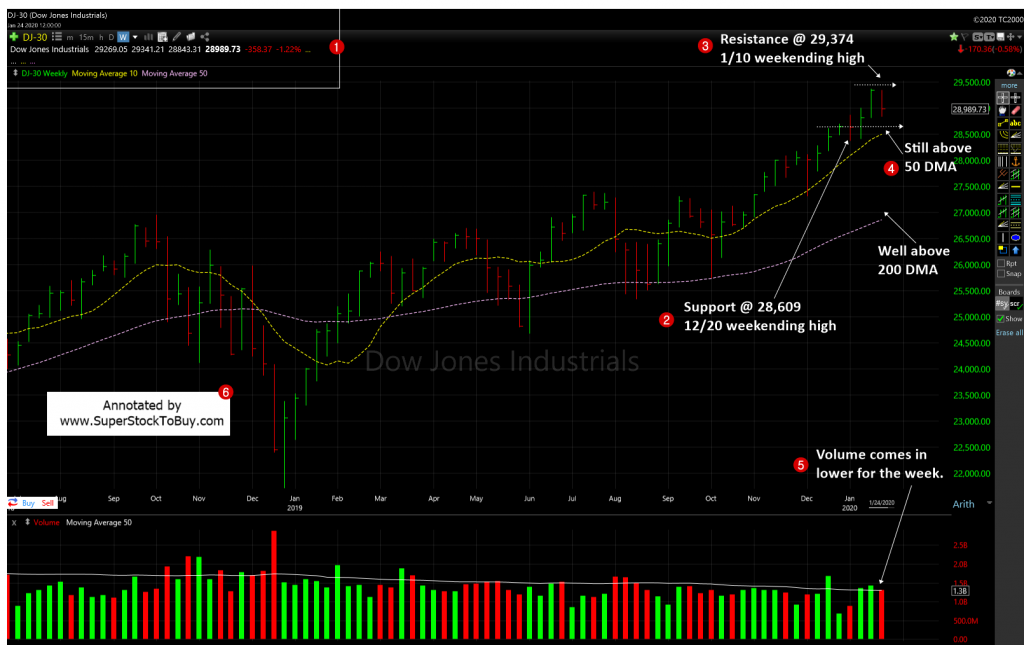
2. As the index pretty much traded within the last week’s range, the support remains at 28,609 which is the 12/20 weekending high.
3. As the index failed to make any new highs, the resistance remains at 29,374 which is 1/17 weekending high.
4. The index still managed to hold above the short term 50 day moving average (DMA) support line.
5. It continues to trade well above the 200 DMA, the long-term support line.
6. The volume appears to be came in lower than last week.
The index posted over -1.2% losses for the week. The Friday’s action was also like a distribution day. But, given the context, the chart still looks healthy,as the overall volume came in lower for the week.
The S&P 500 posted -1% loss. But, the NASDAQ posted less than -1% gain and out still performed, this week, as well. The mega cap growth stocks such as MSFT, FB, APPL remain stay put and lost a fraction of their gains.
So, the line of least resistance remains upwards since 10/4/19. So, just follow the trend until the zero hour arrives to change the course. Having said that, as rally getting little older be cautious with your picks.
Around 189+ stocks posting over 5% gains in the Top Gainers – Growth Stocks Picks, as of this week.
Also do not forget to checkout the Stock Charts Gallery of annotated growth stock charts.
Snapshot of indices performance since 10/4 lows.
| Start | End | Diff (%) | |
| Dow | 25,743.46 | 28,989.73 | 12.61 |
| NASDAQ | 7,700.00 | 9,314.91 | 20.97 |
| S&P 500 | 2,855.94 | 3,245.97 | 13.66 |
Previous week chart: