
Please join with 8,500+ members in our Facebook group and have exclusive discussions and get insights about the growth stocks. Hope to see you there...!!!
Dow Jones Industrial Average (DJIA) – Let’s look at the index’s key support and resistance analysis for the week of December, 06, 2019, using the weekly chart.
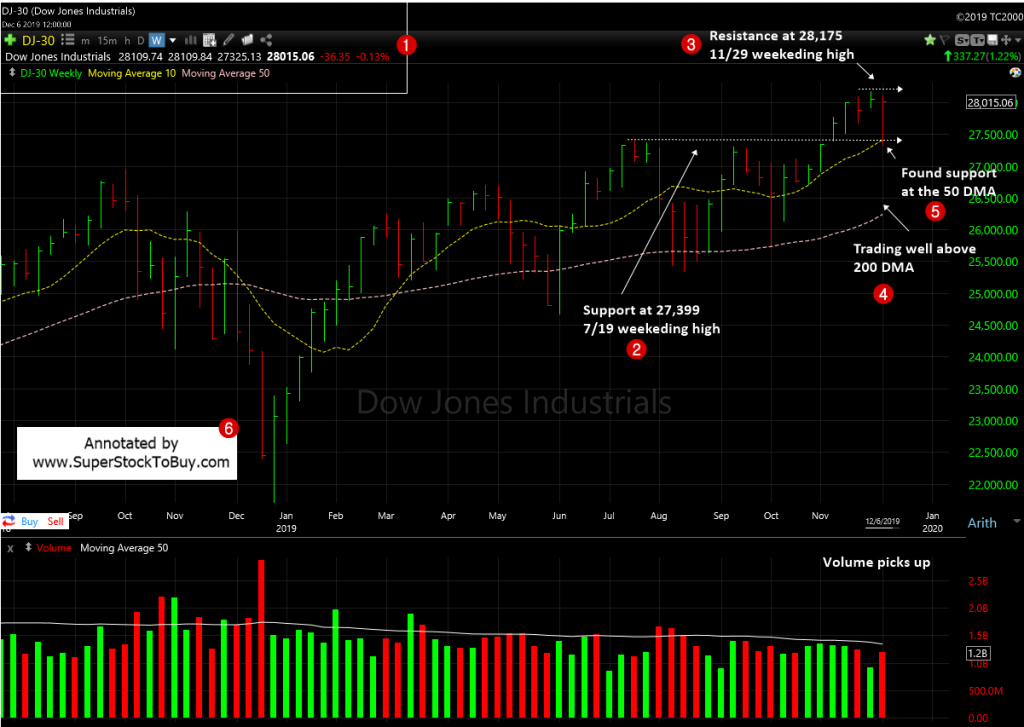
2. As the index successfully tested the last week’s support level, the support remains at 27,399 which is the 7/19 weekending high.
3. As the index closed at the top end of the weekly range, the resistance changed to 28,175 which is 11/29 weekending high.
4. The index successfully tested the 50 day moving average (DMA) line when it came under the selling pressure, this week.
5. But, it still trading well above the 200 DMA which is the long-term support line.
6. The volume picked up pace, but we can’t compare it to the last week, as it was the holiday weekend.
The index came under much needed selling pressure to test the recent run up and successfully weathered it and ended the week at the top end of the trading range.
The NASDAQ and S&P 500 also passed the similar test and the S&P 500 even ended the week in green.
The maga cap growth stocks like MSFT, FB, AAPL, GOOG regained the momentum and showing the strength again.
So, the line of least resistance remains upwards and even the case for long strengthened this week. So, let see the index clear the resistance and make a new high.
Around 109+ stocks posting over 5% gains in the Top Gainers – Growth Stocks Picks, as of this week.
Also do not forget to checkout the Stock Charts Gallery of annotated growth stock charts.
