
Please join with 8,500+ members in our Facebook group and have exclusive discussions and get insights about the growth stocks. Hope to see you there...!!!
Dow Jones Industrial Average (DJIA) – Let’s look at the index’s key support and resistance analysis for the week of November, 22, 2019, using the weekly chart.
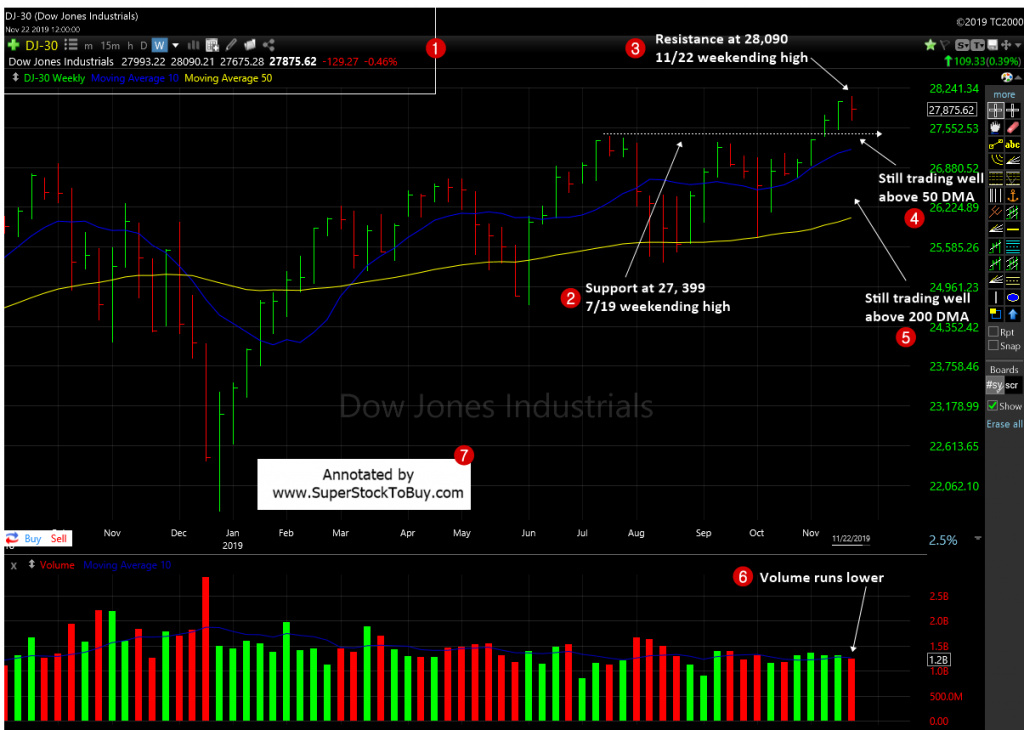
2. Though the index ended the week in red, as the losses were so mild, the support remains at 27,399 which is the 7/19 weekending high.
3. As the index made a new high, then receded, the resistance is at 28,090 for, now.
4. The index still trading well above the short term support line 50 day moving average (DMA).
5. It also trading well above the 200 DMA which is the long term support line.
5. The volume appears to be came in lower for the week.
Over all the index did good, given the recent several weeks of run up. The losses are not that bad, also the volume receded overall for the week.
The NASDAQ and S&P 500 also posted mild losses. But, the volume appears to be spiked for the week in there.
Mega cap growth stocks continue to hold up well. Other growth stocks also made nice gains or stayed put for the week.
So, the line of least resistance remains upwards and yet to be broken. So, let’s see the index make a new high or continue to digest the recent gains.
Around 102+ stocks posting over 5% gains in the Top Gainers – Growth Stocks Picks, as of this week.
Also do not forget to checkout the Stock Charts Gallery of annotated growth stock charts.


